Option Delta
Definition: The Delta of an option is a calculated value that estimates the rate of change in the price of the option given a 1 point move in the underlying asset.
Definition: The Delta of an option is a calculated value that estimates the rate of change in the price of the option given a 1 point move in the underlying asset.
7 Days of Option Lessons Delivered to your Inbox Show Me More »
As the price of the underlying stock fluctuates, the prices of the options will also change but not by the same magnitude or even necessarily in the same direction. There are many factors that will affect the price that an option will change by e.g. Whether it is a call or put, the proximity of the strike to the underlying price, volatility, interest rates and time to expiry. This is why the delta is important; it takes much of the guess work out of the expected price movement of the option.
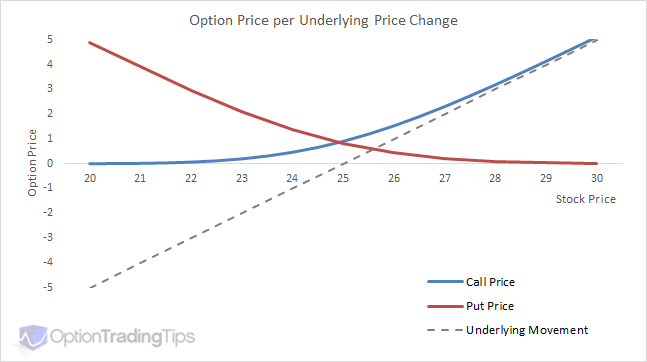
Take a look at the above graph. The chart compares the movement of an underlying versus the option prices at each underlying level for both a call and put option with a $25 strike price. The dotted line represents the price "change" for the underlying with the actual price of the stock on the horizontal axis. The corresponding call and put options for the x-axis stock prices are plotted above; call in blue and put in red.
The first thing to notice is that option prices do not change in a linear movement versus the underlying; the magnitude of the option price change depends on the options' "moneyness". When the stock is at $25 both options are at-the-money and will change in price by the same amount as the underlying moves, which is +/- 0.50. ATM options are therefore said to be "50 Delta".
Now, at either end of the graph each option will either be in or out of the money. On the right you will notice that as the stock price rises the call options increase in value. As this happens the price changes of the call option begin to change in-line with changes in the underlying stock. On the left you will notice the reverse happens for the put options: as the stock declines in value, the put options become more valuable and the increase in the value of the put begins to move 1 for 1 with the underlying (that is a negative move in the stock results in a positive move in the value of the put option).
Note: Delta is only an estimate, although proven to be accurate, and is one of the outputs provided by a theoretical pricing model such as the Black Scholes Model. 1 point means a full dollar movement i.e. From 25.56 to 26.56 is a 1 point increase.
Delta is one of the values that make up the Option Greeks; a group of pricing model outputs that assist in estimating the various behavioral aspects of option price movements.
Deltas for call options range from 0 to 1 and puts options range from -1 to 0. Although they are represented as percentages traders will almost always refer to their values as whole numbers. E.g. If an option has a delta of 0.65 it will be declared by the trader as "sixty five".
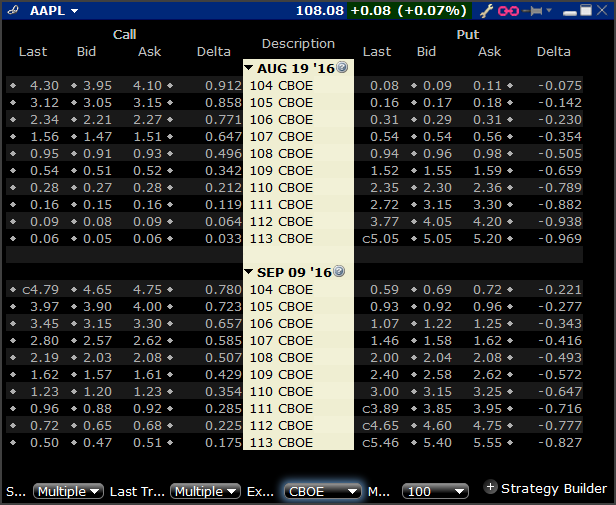
Here is an example of what deltas look like for set of option contracts. The above shows the calls (left) and puts (right) for AAPL options. Notice that the calls are positive and puts are negative.
Now, take the $108 strike for the Aug 19 call options. The market price for this is 0.92 (middle of bid and ask) and it is showing a delta of 0.496. What this number means is if APPLE shares move by 1 point i.E from $108.08 to $109.08 then the price of the call option can be expected to increase in value from 0.92 to 1.42.
The same concept applies to the puts; looking at the $110 strike for the Sep 09 puts. The delta showing for the put option is -0.647. If the stock moves from $108.08 to $109.08 then the option value will decrease from $3.20 to $2.55. The option price decreases in value because the delta of the put option is negative.
Note: the reverse happens for a negative market move; if AAPL shares drop from $108.08 to $107.08 then the Aug 19 $108 call will drop from 0.92 to 0.42 and the Sep 09 $110 put will "increase" from $3.20 to $3.85.
When you see deltas on screen, like the above option chain, they represent the value movement of the option if you were to be the holder of the option i.e. the buyer. So, if you bought a put option, your delta would be negative and the value of the option will decrease if the stock price increases.
However, when you sell an option the opposite happens. For example, if you are short a call option at $1.25 and the price of the option rises to $1.50 then your position is now worse off by -$0.25. In this case you were short delta because a positive move in the underlying had a negative effect on your position.
Here is a summary of option position vs delta sign:
Although the definition of delta is to determine the theoretical price change of an option, the number itself has many other applications when talking of options.
The sign of the delta tells you what your bias is in terms of the movement of the underlying; if your delta is positive then you are bullish towards the movement of the underlying asset as a positive move in the underlying instrument will increase the value of your option. Conversely a negative delta means you're position in the underlying is effectively "short"; you should benefit from a downward price move in the underlying.
Example: let's say you sell an ATM put option that has a delta of -0.50. The delta of the option is negative, however, because you have sold the option, you reverse the sign of the delta therefore making your position delta positive (a negative multiplied by a negative equals a positive).
If the stock price increases by 1 point, a negative delta means the price of the option will decrease by 0.50. Because you have sold the option, which has now decreased in value your short option position has benefited from an upward move in the underlying asset.
Due to the association of position delta with movement in the underlying, it is common lingo amongst traders to simply refer to their directional bias in terms of deltas. Example, instead of saying you have bought put options, you would instead say you are short the stock. Because a downward movement in the stock will benefit your purchased put options.
Option contracts are a derivative. This means that their value is based on, an underlying instrument, which can be a stock, index or futures contract. Call and put options therefore become a sort of proxy for long or short position in the underlying. I.e. Buying a call benefits when the stock price goes up and buying a put benefits when the stock price goes down.
However, we know now that the price movement of the options doesn't often align point for point with the stock; the difference in the future movement being the delta. The delta therefore tells the trader what the equivalent position in the underlying should be. For example, if you are long call options showing a delta of 0.50 then your position in the option is effectively half that of the underlying instrument's value.
To make the comparison complete, however, you need to consider the option contract's "multiplier" or contract size. To read more on using the delta for hedging please read:
This page explains in more detail the process of delta neutral hedging your portfolio and is the most common of the option strategies used by the institutional market.
Many traders also the delta to approximate the likely hood that the option will expire in-the-money.
When the option is ATM, or more precisely, has a delta of 0.50 (-0.50 for puts) then there is an equal chance that the option will be in the money at the expiration date i.e. That the stock will be trading higher than the strike price for the call option or lower than the strike price for the put option.
Changes in the delta as the stock price move away from the strike change the probability of the stock reaching those levels. A call option showing a delta of 0.10 can be said to have a 10% chance of the stock expiring above the call's strike price by the expiration date.
You can see that the delta will vary depending on the strike price. But the delta "at" the strike can also change with other factors.
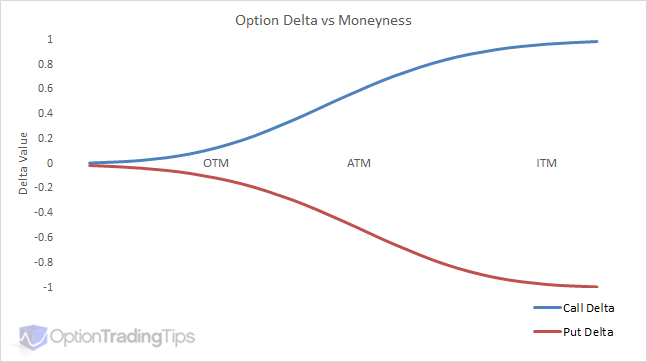
This is a graph illustrating the the change in the delta of both call and put options as each option moves from being out-of-the-money to at-the-money and finally in-the-money.
Notice that the change in value of the delta isn't linear, except when the option is deep in-the-money. When the option is deep ITM the delta will be 1 and at that point will move in-line with the underlying instrument.
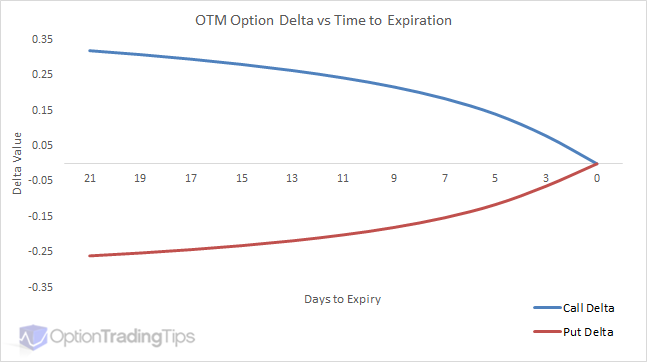
This chart graphs an out-of-the-money call and put. The call option is a $26 strike price and the put option is a $24 strike price. The underlying in this example is a constant $25. The horizontal axis shows the days until expiration. Both call and puts are approximately +/- 25 deltas with 21 days to expiration. As the time erodes there is less and less chance of both expiring in-the-money so the corresponding delta for each option approaches zero as the expiration date closes in.
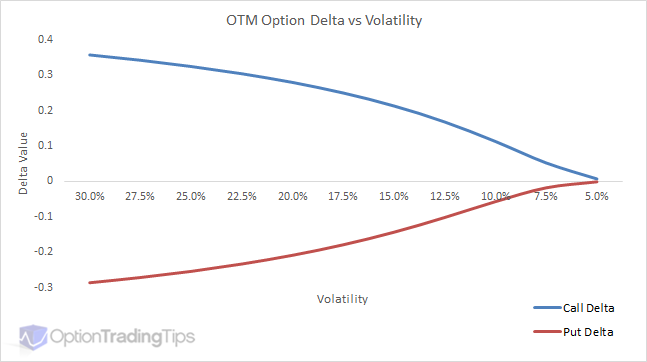
Similar to the Time to Maturity graph, this above chart plots out-of-the-money options vs changes in volatility.
Notice that the changes in shape of the delta curve as volatility approaches zero is similar to the shape of the curve as time to expiration approaches zero?
Here are some key points as discussed above:
I think the best way to understand the behavior of option prices, the greeks etc is to simulate them using an option model. You can download my option spreadsheet from this site or use an online version such as this option calculator.
Feel free to let me know if you have any questions by leaving a comment below.
Sign up for our newsletter and stay up-to-date with option markets, other cool tools being used and interesting news and tips you can use in your own trading.
Includes a free, 7 day learn options email series, which is perfect for beginners!
PeterAugust 31st, 2020 at 7:57pm
Hi Joseph,
No, I don't have a formula but you can use my excel sheet and then use the Goal Seek feature -> Data/What-if Analysis/Goal Seek.
JosephJuly 31st, 2020 at 6:31pm
Hi Peter,
Do you have the formula to calculate the strike price from a delta?
For eg. What would a 25% delta call strike equal?
Where,
Underlying = $41.22
DTE = 76 days; 0.2082 years
Volatility = 35%
InterestRate = 1%
Dividend = 0%
PeterJuly 19th, 2018 at 2:14am
Hi Andres,
There's not enough information from that alone to estimate the Delta. Do you have the expiration date and volatility handy?
AndresJuly 18th, 2018 at 3:36am
Hello,
I just started dealing with options and maybe you can help me. If you have a short put on X shares, where strike price of the put is 250 and the actual market value is 300, what is the delta?
Thanks
PeterMay 8th, 2018 at 6:22am
Mmm, yeah I've heard of put options having positive deltas (hence short puts with negative deltas) as a stock is close to its' ex-dividend date, however, I'm not exactly sure why that is...perhaps because the forward and the spot the day before the stock goes ex can be so different.
But I'm not sure what you mean by stock price movements by highest or lowest angles and also on the limit of option contracts; I didn't know there was a limit on the number of contracts available to be traded. If you have a chance to explain, that would be great, thanks!
AnonymousMay 5th, 2018 at 11:34am
Though you're correct in your explanation, the point here is that delta can be negative of a short put also. Say, in a continued bear phase. It can even increase to above 1 for OTC contracts, or in markets that lack proper regulation. At times, you'll be surprised to know, delta reverses on its own. Say, in case of stock price moving on the highest or lowest angles. Say, in markets where there is no limit on number of options one can take part in, delta can be brought above 1 also.
PeterAugust 6th, 2017 at 10:27pm
Hi Ryan,
Many thanks for the correction! I've updated it to at-the-money.
Ryan JacobsAugust 4th, 2017 at 2:04pm
In the section where you are talking about LONG AND SHORT OPTION DELTA, I believe you have a typo in the following paragraph that might throw people off.
The first thing to notice is that option prices do not change in a linear movement versus the underlying; the magnitude of the option price change depends on the options' "moneyness". When the stock is at $25 both options are in-the-money and will change in price by the same amount as the underlying moves, which is +/- 0.50. ATM options are therefore said to be "50 Delta".
When the stock is at $25 both options are in-the-money and will change in price by the same amount as the underlying moves, which is +/- 0.50. ATM options are therefore said to be "50 Delta".
*** This should say "When the stock is at $25 both options are AT-THE-MONEY, not in in-the-money like you have listed ***
PeterDecember 18th, 2016 at 3:16am
Hi Josh,
The below graph might help explain this. This is a $25 call delta with one day to expiration plotted against stock price.
When an option is trading right near ATM before expiration, the stock price ticking above or below the strike will change the positional value from being long 100 shares or nothing at all. I.e. the option will either be worthless or be worth the intrinsic value (the current market price).
Expiration day is the most challenging for traders who have large option positions to hedge as they need to pay careful attention to those ATM options as they can swing from having a large stock position to hedge or not.
JoshDecember 17th, 2016 at 10:16pm
Hi,
Why does hedging ATM options become difficult as expiry time goes to 0?
I know it has something to do with gamma, since gamma goes to infinity when expiration time goes to 0 and thus delta is increasing extremely fast. Therefore the hedge ratio is constantly changing at a high rate. Is there a more intuitive explanation?
PeterAugust 16th, 2015 at 10:30pm
Hi Kenan,
Mmm, tough question! Honestly, I've no idea sorry. But is sounds like it's asking for the VaR at the different confidence levels. Check out the method and graph in the following page;
Calculating VaR for Options and Futures
Does this help?
KenanAugust 15th, 2015 at 1:36pm
Hi Peter,
Hope you are doing well, I stuck one question can't figure out. I would really appreciate if you help about that. Here is the question:
Assume that we operate under the assumptions in BlackScholes. Also assume the following: S=200 (current stock price), K=200 (strike price) return stock per year (nu)=8% Volatility of stock per year=25%, r=3% per year and the time to maturity for the option is 126 trading day(=0.5 year).
a) calculate the true 10 day VaR and the 10 day Delta-Gamma-VaR at the 97.5% confidence level for a long standard european put option. (z0.025=-1.960(=-z0,975).
b) draw figure to illustrate the difference in VaR estimates (in question a)
Solution a)
d1=0.173
Critical stock price S=230.5 (prob=0,975)
S=174.9 (p=0,025)
VaR0,975=25
delta put=-04312
gamma put=0,0111
VaR(long put)0,975(delta)=-12,936
VaR(long put)0,975(gamma)=-7,98
I could not draw the figure in "b)". Thanks in advance.
PeterJune 10th, 2015 at 10:57pm
Hi Gags,
1) I would say OTM options are more attractive to option traders because they contain more "optionality". That is, they are more sensitive to option specific factors like volatility and time to expiration. As an option becomes more and more ITM they behave more like the underlying stock and less like options.
2) OTC market makers aren't making their quotes live on the exchange; they are being made via messaging services like Bloomberg chat. Because of this, a strike and price quote won't be valid when the underlying market moves. So they then peg their quote to a delta instead of the strike. If the market maker quotes a price for a call and the market rallies, s/he may still honour the quote on a higher strike provided the delta is still within range.
GagsJune 10th, 2015 at 7:43pm
Hi ,
I few basic questions :
1) Why 25 delta options are the most liquid option .
2) why otc markets trader quote in terms of deltas and implied vol. For a layman i would approach a trader to quote a call / put for a strike price.
Gags
PeterJanuary 26th, 2015 at 4:46am
Hi Raja,
You can enter that data in my option pricing spreadsheet to calculate the option delta and other greek values.
RajaJanuary 26th, 2015 at 3:11am
Underlying price = 20
Exercise price = 18
Today's date = 16 Apr 2013
Expiry date = 30 Jun 2014
Historical volatility = 22%
Risk free rate = 5%
Dividend yield = 0%
How to calculate Delta Gamma
Please explain step by step
PeterNovember 30th, 2014 at 7:32pm
Hi sHag91,
Why do you say that? As the stock price declines the put will approach a delta of -1 and as it rises the delta approaches 0 as there is less and less chance of the option expiring in the money (ITM put is where stock < strike).
sHag91November 29th, 2014 at 2:57pm
I think the second graph (put delta) is wrong. It should be graphed just like it is in the first graph
PeterNovember 3rd, 2014 at 5:21pm
That's right BullDaddy. The contract delta of a put is negative but because you are short the put, your position delta is positive.
BullDaddyNovember 1st, 2014 at 8:09am
Peter,
So with 1 short put @100 in zztop with a delta of .5 and a gamma of .04 what is the delta if zztop goes to 99?
I realize that a short has a positive delta, it would seem to me that the delta would go to .54 because the risk of the short put closing ITM would be greater? Is that correct?
thx!
BD.
PeterOctober 10th, 2014 at 4:25pm
Hi SaulusPaulus,
The theoretical price for a call and put will be the same where the strike = ATM Forward price. Where the ATM Forward is the spot price + cost of carry - expected dividends. However, this is not the same as (Call Price * Delta) = (Put Price * Delta). I don't think there is a relationship between (Call Price * Delta) and (Put Price * Delta) that is easily observable.
Typically the ATM Forward price is slightly higher than the current spot price. But even at this price the deltas of the options won't be the same; the call delta will be approximately 52 and the put -48.
You're welcome to use my option pricing spreadsheet - it's a good way to familiarise yourself with the theoretical values by playing around with various scenarios and viewing the changes that take place after changing the inputs to the model.
SaulusPaulusOctober 10th, 2014 at 11:04am
Hello Peter,
Thanks for your very informative website.
I have a few theoretical questions regarding the delta for European Calls/Puts in the Black Scholes Framework.
1. For what spot price is |delta*Call| = |delta*Put| ?
2. When |delta*Call| = |delta*Put|, what is the delta? Which Option is worth more?
Delta should be 0 and Call option should be worth more as its value is not capped through the stock price?
Thanks in advance!
PeterMarch 27th, 2014 at 5:37am
Hi Anu,
Not sure what you mean by CE/PE - but you can either use my option spreadsheet or an online option calculator to simulate various option greek and pricing values.
anuMarch 27th, 2014 at 1:58am
hi..
i started he option trading now a days.so please give me guidance.i know the basics.but is there any calculations for Eg:what give the market today(CE/PE) and how much points. or what will be the tomorrows status..Please help..
Thank you.
VeggiesJune 2nd, 2013 at 1:18pm
I'm not sure how to solve this question. Can anybody help me please. ugently!
A delta-neutral position is a portfolio that is immune to changes in the stock price, the portfolio of options and stock has a position delta of 0.0.
∆p=n1∆1 + n2∆2 + ...=0
Example
Suppose you are 100 puts long with a delta of -0.3.
How many calls, delta of which is -0.83, should you buy or sell to create a delta-neutral position?
∆p=n1∆1 + n2∆2 =0
(100)(-0.3) + n2(-0.85) =0
n2 = -35.29
Negative sign means the call should be sold.
PeterApril 16th, 2013 at 6:31pm
Hi Johnny,
I see now - it's the definition of gamma that has caused confusion. "Gamma" measures the change in delta for a "1 point" move in the underlying i.e. from 25 to 26.
Your example has used "Gamma 1%", which will measure the change in delta from a 1% move i.e. 25.25. Hence the need to divide by 100.
johnnyApril 16th, 2013 at 2:12am
Hi Peter, let's stimulate the below scenario with the free spreadsheet in your site.
Underlying price = 20
Exercise price = 18
Today's date = 16 Apr 2013
Expiry date = 30 Jun 2014
Historical volatility = 22%
Risk free rate = 5%
Dividend yield = 0%
We come up with below:
Theoretical price (call) = 3.7011
Delta = 0.79
Gamma = 0.0597
Let multiplier = 500 and quantity = 25
Total market value = 3.7011 * 500 * 25 = 46264
Cash delta = 0.79 * 20 * 500 * 25 = 197505
Cash gamma = 0.0597 * 20 * 20 * 500 * 25 / 100 = 2983
So assume underlying price moves up by 1% (0.2) to 20.2
New theoretical price (call) = 3.8603
Total market value = 3.8603 * 500 * 25 = 48254
Total PL impact = 48254 - 46264 = +1990
Delta PL impact = 197505 * 1% = +1975
Gamma PL impact = 2983 * 1% / 2 = +15
Delta and gamma PL impact = 1975 + 15 = +1990 which reconciles to total PL impact above
So cash gamma has to be divided by 100 to arrive the sensitivity PL impact - but why...?
Can you please advise and explain? Thanks!
PeterApril 16th, 2013 at 12:01am
Hi Johnny,
Yep, you're right about the multiplier - I missed that. I'll change the formula in my comment. However, I'm not sure why they have divided by 100.
If you simulate your position by moving the base price by 1 point does your cash delta of position change by the cash gamma amount?
johnnyApril 15th, 2013 at 9:46pm
Thanks Peter for the cash greeks formula. I refer to the cash gamma forumla, from my company's risk system, the formula would be:
Cash Gamma of position = gamma of contract * position * underlying price * underlying price * multiplier / 100 (in which * multiplier / 100 are not found in your formula)
Could you please advise and explain?
PeterMarch 25th, 2013 at 9:30pm
Hi Johnny,
To calculate cash greeks;
Cash Delta of position = delta of contact * multiplier * position * underlying price
Cash Gamma of position = gamma of contract * multiplier * position * underlying price * underlying price
Cash Vega of position = vega of contract * position * multiplier
Cash Theta of position = theta of contract * position * multiplier
Note: Vega and Theta are already expressed in dollars hence no need to multiply by the underlying price.
johnnyMarch 21st, 2013 at 10:00pm
Hi Peter,
I refer to the delta exposure in dollar term of an call option, say:
Spot = 20
Strike = 18
Delta = 0.79
Multiplier = 10
The delta exposure in dollar term = 0.79*10*18 = 142.2
So when spot increases by 1%, delta p&l will be roughly 142.2*1% = 1.42
My question is, is there any forumla which I can quickly calculate the other greek exposure in dollar term, say vega/ gamma/ theta and rho?
Mnay thanks!
SATISH GUPTAJune 27th, 2012 at 9:34am
Please help me for delta hedging or delta skew. How can i find them.
PeterFebruary 19th, 2012 at 7:01pm
Hi Eg,
 but couldn't see it explained.
Mmm...if you use a flat volatility (i.e. the same volatility for all strikes) you will see this and I think this is just one of the limitations of using a theoretical pricing model.
In the option markets, the volatility will be different for every strike price - for equity options, downside strikes generally have a higher volatility as stocks fall faster than they rise and hence will reach the strike faster than for upper strike prices.
I could be wrong though - there may well be a quantitative explanation for this, however, I had a quick look through Natenbergs' - Option Volatility and Pricing
If you find another reason for this, please let me know and I will document it here.
EgFebruary 19th, 2012 at 1:49pm
Given lognormal prices it would be expected that, say, a 30 Call would have a higher time value than a 20 Put when the price is at 25 (both equally OTM) due to the slight skew to the positive. But why does a 30 Put have have a higher time value than a 20 Call when the price is 25? You would expect it to be the other way around! It seems to depend on the strike, but why?
PeterFebruary 15th, 2012 at 10:15pm
They will be very close to it, however, as soon as the market moves in either direction the position will accumulate/lose delta, which will need to be re-hedged to remain delta neutral.
MikeFebruary 15th, 2012 at 6:57am
Is a portfolio consisting of a Long Put and a Long Call delta-neutral if both options have the same Strike price and are trading at the money?
PeterJanuary 19th, 2012 at 3:46pm
Thanks Eric! I work in software sales and trade in my spare time ;-)
EricJanuary 19th, 2012 at 10:50am
Thank you very much. Excellent site btw - what is your line of work?
PeterJanuary 18th, 2012 at 3:55pm
Yes, correct - Delta is calculated from a pricing model such as B&S so it represents the theoretical change in the option price given a one point move in the underlying asset.
EricJanuary 18th, 2012 at 8:20am
I notice that on the vega page you write that the vega represents the THEORETICAL change in the option price/ change in volatility.
Does the same go for the delta? Is it only theoretical since the change in price is assuming hte market is using BS to price the option?
Thank you,
PeterNovember 9th, 2011 at 8:27pm
If the underlying stock drops by 5pts then the option price (theoretically) will either rise or fall (depending on if it is a call or put option) by 0.75 (0.15 x 5).
TyNovember 9th, 2011 at 8:16pm
So what happens if the underlying stock price goes down 5pts, and the delta was .15 the day before....wouldn't the value of the delta also decrease?
ChrisNovember 2nd, 2011 at 5:55pm
Yes, I think the diagrams imply a normal distribution of share price movements, but I guess that's because of the erroneous assumption in black-scholes.
PeterNovember 2nd, 2011 at 5:08pm
Hi Chris,
Yes, the skew affects the prices (and hence the greeks) of calls and puts differently. Generally, for equity options puts have higher volatilities than for call options with the same strike difference from ATM.
Is this what you mean?
ChrisNovember 2nd, 2011 at 4:05pm
Thanks this site is very helpful.
Could you clarify one thing - assuming equity movements are skewed to the downside, would skew alter the delta of a put option vs a call option (i.e. would the delta of an out-of-the money put option be further from zero than a similarly out-of-the money call option?)
Chris
PeterSeptember 26th, 2011 at 6:41pm
My deltas for AAPL look fine, see link below;
AAPL Options
Can you send me a screen shot of what you see?
JoseSeptember 26th, 2011 at 2:55pm
Today apple calls have been tradin with an inverted delta curve, meaning OTM calls have a higher delta than ATM calls. Is that common. Can someone explain this to me?
PeterSeptember 4th, 2011 at 6:39pm
No, the graphs are correct. You are not reading them correctly.
The first graph is plotting the delta values against OTM/ATM/ITM concepts - not market price. For an OTM put the delta is zero, which is what this graph shows.
A put delta is never +1 as you mention - a put delta can only be between -1 and 0.
MohaSeptember 4th, 2011 at 4:33pm
Hi,
Excuse me, but your Graph is WRONG: the delta of a put is -1 when the underlying is around zero (Out of The Money OTM) and around +1 when the put is In The Money ITM,Please amend
PeterAugust 20th, 2011 at 1:37am
A call option delta is between 0 and 1, while a put option delta is between -1 and 0. But because the stock IS the underlying its delta is always 1.
kanchanAugust 19th, 2011 at 9:46am
isn't it between o and 1 ??
PeterAugust 16th, 2011 at 7:34am
That isn't possible: the delta of a stock is always 1.
kanchanAugust 16th, 2011 at 7:19am
If a stock has a delta of 0.6 at $45 and 0.8 at $50... what does this mean?
PeterJune 25th, 2011 at 2:18am
Yes, exactly. The graphs above are for long call and put deltas.
AnitaJune 24th, 2011 at 10:53pm
Hi ,
Will the graph of short call and short put be the inverse of the 2 graphs shown above .
PeterMarch 1st, 2011 at 10:05pm
Hi Tom, you'll need some kind of option pricing software to do this. You can use my option pricing spreadsheet as a starting point. However, you might also want to check with your broker as many online brokers provide such functionality in client front ends.
What broker do you use?
TOMMarch 1st, 2011 at 9:40pm
If i buy 10 calls and 10 puts ATM of a 50 dollar stock, and say the calls cost me 4 each and the puts cost 3 each and the expiration is 60 days out, when the stock moves up or down how do i know when and how to adjust to get back to delta neutral. As the stock goes to 53 or 47, how do i know what the delta is and how do i trade it.............
PeterFebruary 11th, 2011 at 3:15am
Yes.
SaravananFebruary 11th, 2011 at 12:30am
I am from india. I am a basic learner of options. Is put delta nd put option value inversely proportional?
PeterJanuary 3rd, 2011 at 10:41pm
Delta values range between -1 and + 1, so -1,466.80 seems strange...unless there is some kind of multiplier being applied.
Anyway, it just means that if the base price (e.g. stock price) moves up 1 point then the value of the put option is expected to decrease 1,466.80 points.
YEOJanuary 3rd, 2011 at 9:46pm
Hi,
If the put option got -1466.80 (delta), what is this means ?
PeterDecember 22nd, 2010 at 3:57pm
Yes, although it doesn't depend on the time to expiration as much as it does on the interest rate. As long as the strike is equal to (or as close as possible) to the forward price, then yes, ATM options will have deltas very close to 50%.
You can try it on this web based online option calculator. Make the interest rates and dividend yield = 0 so that the forward price will equal the strike you are after and just change around the days to expiration field.
PrasunDecember 22nd, 2010 at 6:22am
Hi,
for an ATM Call Option, will the Delta always hover around 50%? doesnt maturity period have any impacts? In other words, will 2 ATM options, one with an expiry of 1m and another with 1 yr, have 50% deltas?
PeterNovember 23rd, 2010 at 6:53pm
Yep, you're right. Thanks for the clarification!
KNovember 23rd, 2010 at 2:11pm
Hey Peter,
Love your site. Good work, and thanks.
Your last comment on this page was, "the put delta will also decrease as the option moves further out-of-the-money."
However, won't the put option increase (e.g. move closer to zero from negative one) as the option moves further OTM?
PeterOctober 10th, 2010 at 12:22am
No, but here's an online version;
[link removed, site no longer active]
GeorgeOctober 9th, 2010 at 2:38pm
I guess it can't calculate the Greeks of barrier options
any links?
PeterAugust 28th, 2010 at 12:52am
How do you mean...because it's negative?
juanAugust 27th, 2010 at 11:55pm
the put graph seems to be wrong ?
PeterAugust 1st, 2010 at 9:01pm
It's the relationship between volatility (probability of option expiring in the money) and time being non-linear - asset volatility follows a log-normal distribution.
Option Theta is highest for strikes at (close to) the money and tapers off either side in a non-linear fashion.
samJuly 31st, 2010 at 2:23pm
what is the financial intuition behind time value of option decreasing convexly for strikes away from asset price?
PeterJune 3rd, 2010 at 10:04pm
You'll have to calculate the Greek values. You can use the spreadsheet found under the pricing link. Or, you can go to;
www.option-price.com
SundraaJune 3rd, 2010 at 12:47pm
Forget continuous or discrete compounding.. just take it this way. Long Call option profit is virtually unlimited... whereas with a long put, your profits has a cap (because stock prices cannot go below 0). So call option can give you more returns than a put option and hence delta of ATM call is greater than a put.
RayJune 2nd, 2010 at 1:38pm
Gentlemen, where do I go to get current option delta values?
PeterDecember 23rd, 2009 at 4:33pm
I disagree. It is the compounding of those factors that causes the curve to skew to the upside, hence becoming log normal. Without compounding the curve is symmetrical as the returns to the upside have no bias over those to the downside. When you begin to compound the returns, you will notice that a compounded negative rate of return yields a lower absolute change than a return that is positive.
For example, if you take $100 at a 5% return and compound it for 10 years you end up with a profit of $62. If you take -5% you will lose only $40, hence the skew to the upside.
MarcDecember 18th, 2009 at 2:35pm
Your explanation of the log normal distribution (LGD) is wrong. The LGD is not used over a normal because option models are "continuous". Both normal and lognormal are continuous. Lognormal is used for the simple fact that is a natural way to enforce positive asset prices. This in turn introduces a skew that does not exist in the normal distribution. Continuous compounding rates, dividends, and volatility, have absolutely nothing to do with it.
AlanDecember 17th, 2009 at 11:53pm
Thank you very much Peter. Really appreciate your help.
PeterDecember 15th, 2009 at 6:40pm
Hi Alan,
Yes, this is due to the Log Normal Distribution curve that is used by the Black and Scholes model to estimate the "rate of return" (interest and volatility). The Log Normal curve is used over a Normal Distribution because option models are considered continuous, where volatility, interest and dividends are taken to be continuously compounded and hence produce and upward bias in returns.
AlanDecember 15th, 2009 at 8:19am
Hi Peter, i have a question regarding ATM call and put. ATM calls seems to be like 52 delta and ATM put seems to be around 48 delta. there were some comments made saying its due to Black Scholes model preference for puts over call. Would appreciate if you can help to explain.
PeterNovember 10th, 2009 at 4:21am
Hi Ashi, a Box Spread is a combination of two opposing vertical spreads i.e. a long call spread and a short put spread. Both spreads would have the same strikes and expiration date.
The idea is that the credit received for the short spread is more than what is required to be paid for the long spread and hence a risk-free profit is locked in.
Regarding Collars vs Bull Spread...this depends on your capital requirements and the prices for the option components. A Collar consists of a long stock meaning a much greater burden on your trading account.
AshiNovember 9th, 2009 at 5:10pm
Hiya
I stumbled upon your page while preparing for an exam :) and I found your material really useful.
what is a BOX SPREAD by the way? And I am always confused between choosing a Collar options verus a call Bull spread...both profiles look the same... when do you choose one or the other?
Jo JackJuly 7th, 2009 at 2:04am
Peter,
Your graph is correct. Thank you for all the information on this site.
PeterMay 22nd, 2009 at 3:14am
Hi Steve,
Actually, I think it is correct. The graph is showing the delta of a 50 strike put option, which has a negative delta. As the stock price declines, the option becomes shorter hence the delta approaches -1. When the put option is deep in the money the delta will reach -1 and behave like a short underlying position.
As the stock price increases and becomes out of the money the delta will approach zero and eventually become worthless.
Let me know if you dissagree.
SteveMay 22nd, 2009 at 1:15am
Your put option graph is reversed. The red line in the bottom graph should has the wrong slope.
aranjanApril 9th, 2009 at 3:59am
Very good explanation
PratapJanuary 21st, 2009 at 11:42pm
Very Useful......
Rating - 5 out of 5
Add a Comment