Black-Scholes Option Model
The Black-Scholes Model was developed by three academics: Fischer Black, Myron Scholes and Robert Merton. It was 28-year old Black who first had the idea in 1969 and in 1973 Fischer and Scholes published the first draft of the now famous paper The Pricing of Options and Corporate Liabilities.
The concepts outlined in the paper were groundbreaking and it came as no surprise in 1997 that Merton and Scholes were awarded the Noble Prize in Economics. Fischer Black passed away in 1995, before he could share the accolade.
The Black-Scholes Model is arguably the most important and widely used concept in finance today. It has formed the basis for several subsequent option valuation models, not least the binomial model.
What Does the Black-Scholes Model do?
The Black-Scholes Model is a formula for calculating the fair value of an option contract, where an option is a derivative whose value is based on some underlying asset.
In its early form the model was put forward as a way to calculate the theoretical value of a European call option on a stock not paying discrete proportional dividends. However it has since been shown that dividends can also be incorporated into the model.
In addition to calculating the theoretical or fair value for both call and put options, the Black-Scholes model also calculates option Greeks. Option Greeks are values such as delta, gamma, theta and vega, which tell option traders how the theoretical price of the option may change given certain changes in the model inputs. Greeks are an invaluable tool in portfolio hedging.
Black-Scholes Equation
Call Option = 
Where:
Given Put Call Parity:
The price of a put option must therefore be:
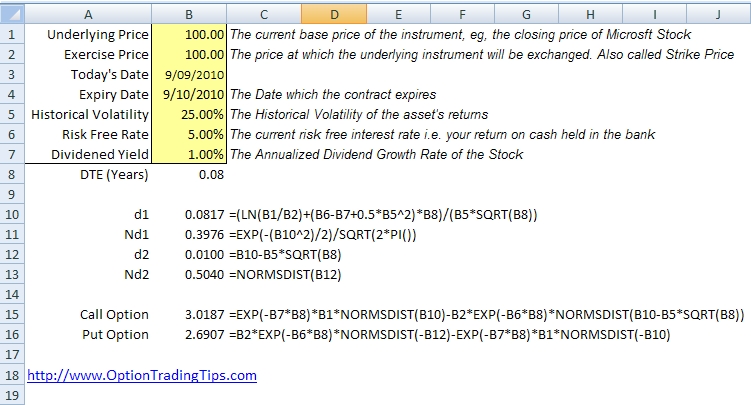
Black-Scholes Excel
Black-Scholes VBA
Function dOne(UnderlyingPrice, ExercisePrice, Time, Interest, Volatility, Dividend)
dOne = (Log(UnderlyingPrice / ExercisePrice) + (Interest - Dividend + 0.5 * Volatility ^ 2) * Time) / (Volatility * (Sqr(Time)))
End Function
Function NdOne(UnderlyingPrice, ExercisePrice, Time, Interest, Volatility, Dividend)
NdOne = Exp(-(dOne(UnderlyingPrice, ExercisePrice, Time, Interest, Volatility, Dividend) ^ 2) / 2) / (Sqr(2 * 3.14159265358979))
End Function
Function dTwo(UnderlyingPrice, ExercisePrice, Time, Interest, Volatility, Dividend)
dTwo = dOne(UnderlyingPrice, ExercisePrice, Time, Interest, Volatility, Dividend) - Volatility * Sqr(Time)
End Function
Function NdTwo(UnderlyingPrice, ExercisePrice, Time, Interest, Volatility, Dividend)
NdTwo = Application.NormSDist(dTwo(UnderlyingPrice, ExercisePrice, Time, Interest, Volatility, Dividend))
End Function
Function CallOption(UnderlyingPrice, ExercisePrice, Time, Interest, Volatility, Dividend)
CallOption = Exp(-Dividend * Time) * UnderlyingPrice * Application.NormSDist(dOne(UnderlyingPrice, ExercisePrice, Time, Interest, Volatility, Dividend)) - ExercisePrice * Exp(-Interest * Time) * Application.NormSDist(dOne(UnderlyingPrice, ExercisePrice, Time, Interest, Volatility, Dividend) - Volatility * Sqr(Time))
End Function
Function PutOption(UnderlyingPrice, ExercisePrice, Time, Interest, Volatility, Dividend)
PutOption = ExercisePrice * Exp(-Interest * Time) * Application.NormSDist(-dTwo(UnderlyingPrice, ExercisePrice, Time, Interest, Volatility, Dividend)) - Exp(-Dividend * Time) * UnderlyingPrice * Application.NormSDist(-dOne(UnderlyingPrice, ExercisePrice, Time, Interest, Volatility, Dividend))
End Function
You can create your own functions using Visual Basic in Excel and recall those functions as formulas within your chosen workbook. If you want to see the code in action complete with Option Greeks, download my Option Trading Workbook.
The above code was taken from Simon Benninga's book Financial Modeling, 3rd Edition. I highly recommend reading this and Espen Gaarder Haug's The Complete Guide to Option Pricing Formulas
. If you're short on option pricing formulas texts, these two are a must.
Model Inputs
From the formula and code above you will notice that six inputs are required for the Black-Scholes model:
- Underlying Price (price of the stock)
- Exercise Price (strike price)
- Time to Expiration (in years)
- Risk Free Interest Rate (rate of return)
- Dividend Yield
- Volatility
Out of these inputs, the first five are known and can be found easily. Volatility is the only input that is not known and must be estimated.
Black-Scholes Volatility
Volatility is the most important factor in pricing options. It refers to how predictable or unpredictable a stock is. The more an asset price swings around from day to day, the more volatile the asset is said to be. From a statistical point of view volatility is based on an underlying stock having a standard normal cumulative distribution.
To estimate volatility, traders either:
- Calculate historical volatility by downloading the price series for the underlying asset and finding the standard deviation for the time series. See my Historical Volatility Calculator.
- Use a forecasting method such as GARCH.
Implied Volatility
By using the Black-Scholes equation in reverse, traders can calculate what's known as implied volatility. That is, by entering in the market price of the option and all other known parameters, the implied volatility tells a trader what level of volatility to expect from the asset given the current share price and current option price.
Assumptions of the Black-Scholes Model
1) No Dividends
The original Black-Scholes model did not take into account dividends. Since most companies do pay discrete dividends to shareholders this exclusion is unhelpful. Dividends can be easily incorporated into the existing Black-Scholes model by adjusting the underlying price input. You can do this in two ways:
- Deduct the current value of all expected discrete dividends from the current stock price before entering into the model or
- Deduct the estimated dividend yield from the risk-free interest rate during the calculations.
You will notice that my method of accounting for dividends uses the latter method.
2) European Options
A European option means the option cannot be exercised before the expiration date of the option contract. American style options allow for the option to be exercised at any time before the expiration date. This flexibility makes American options more valuable as they allow traders to exercise a call option on a stock in order to be eligible for a dividend payment. American options are generally priced using another pricing model called the Binomial Option Model.
3) Efficient Markets
The Black-Scholes model assumes there is no directional bias present in the price of the security and that any information available to the market is already priced into the security.
4) Frictionless Markets
Friction refers to the presence of transaction costs such as brokerage and clearing fees. The Black-Scholes model was originally developed without consideration for brokerage and other transaction costs.
5) Constant Interest Rates
The Black-Scholes model assumes that interest rates are constant and known for the duration of the options life. In reality interest rates are subject to change at anytime.
6) Asset Returns are Lognormally Distributed
Incorporating volatility into option pricing relies on the distribution of the asset’s returns. Typically, the probability of an asset being higher or lower from one day to the next is unknown and therefore has a 50/50 probability. Distributions that follow an even price path are said to be normally distributed and will have a bell-curve shape symmetrical around the current price.
It is generally accepted, however, that stocks – and many other assets in fact – have an upward drift. This is partly due to the expectation that most equities will increase in value over the long term and also because a stock price has a price floor of zero. The upward bias in the returns of asset prices results in a distribution that is lognormal. A lognormally distributed curve is non-symmetrical and has a positive skew to the upside.
Geometric Brownian Motion
The price path of a security is said to follow a geometric Brownian motion (GBM). GBMs are most commonly used in finance for modelling price series data. According to Wikipedia a geometric Brownian motion is a “continuous-time stochastic process in which the logarithm of the randomly varying quantity follows a Brownian motion". For a full explanation and examples of GBM, check out Vose Software.
PeterAugust 14th, 2018 at 10:25pm
Hi Gary,
No, dTwo = dOne(UnderlyingPrice, ExercisePrice, Time, Interest, Volatility, Dividend) - Volatility * Sqr(Time). So if you change the last part of that formula you will double up on the -Volatility * Sqr(Time) component.
You are welcome to try but when I did this for an ATM call/put the call price doubled the price of the put. If interest rates and divs are zero, the call and put price should match for an ATM strike.
Also, I've made some changes to the spreadsheet so the VBA is a little clearer. The old "CallOption" functions are still there but I've also added a new module that makes the calculations easier to read:
Option Workbook
GaryAugust 13th, 2018 at 9:37pm
Hi,
I was reviewing this page so I could use the formulas. Thank you for providing this information.
I do have a question on the CallOption function VBA code on this page. Shouldn't this last part of the calculation be changed from Application.NormSDist(dOne(UnderlyingPrice, ExercisePrice, Time, Interest, Volatility, Dividend) - Volatility * Sqr(Time) to Application.NormSDist(dTwo(UnderlyingPrice, ExercisePrice, Time, Interest, Volatility, Dividend) - Volatility * Sqr(Time)?
I am not an expert by any means. However, I get the answer you show when I make this change. I apologize if this has been discussed before. I did not read thru all comments.
Thank you!
PeterApril 21st, 2018 at 12:53am
Hi Prakash,
The formula itself doesn’t consider holidays but the user would consider holidays and other non-trading days in determining the number of days until expiration. This number would then be used in the formula.
PrakashApril 19th, 2018 at 5:20am
In this formula Market holidays not considered, is there any way for considering the market holidays ?
SHAKEEL AHMEDJune 10th, 2017 at 11:02am
Black Scholes model/formula/equation is very complicated.Some calculator based on it is very useful.Using this calculator,I have observed something.I have taken data like this.Call option,spot price=110,strike price=100,risk free interest=10%,expiry time=30 days,implied volatility=30%,but it reduces daily @1%.All datas are imaginaries.Only theoretical datas of option premium are derived.Analysis,on 10th day,premium drops from 11.31 to 10.61=0.70,on 20th day,premium drops from 10.61 to 10.30=31,on 30th day,premium drops from 10.30 to 10.02=0.28.If option is in 10% of in-money,it is profitable from 1.31 to 0.02 anywhere.1st 10 day,volatility is good,if direction is ok,profit will be @0.10.Last 10 day,volatility is low,if direction is ok,profit will be @0.03.Result,use in-money option,trading in 1st 10 days of 30 days movement,keep direction in your favour.True direction is real winning formula,not B/S-formula,i think so.
PeterMarch 8th, 2017 at 10:59pm
Are you using the file black-scholes-excel.xls? It works fine for me...have you "enabled" the content when opening the document?
AnonymousMarch 2nd, 2017 at 7:50am
Your calculator is not calculating correctly for stocks so kindly fix it.
Regards
PeterFebruary 28th, 2016 at 6:32pm
Hi Matt,
It is not possible to value the option without knowing the value of the underlying asset. A published market share price would be considered the most accurate, however, it is not the only way to value a company.
There are other methods of valuing a company, provided you have access to the necessary information. You might want to consider evaluating the methods listed below in order to arrive at a valuation price for the company:
Stock Valuation Methods
MattFebruary 27th, 2016 at 8:51pm
Hello, I am trying to figure out what to input in the market price with an employee stock option when the strike price is $12.00, but the stock is not yet publically traded and therefore there is no stock price to input. Can the Black Scholes equation be used in this case.
I am an attorney, and the Judge (also not a financial person) has suggested looking at this method to value the option.
It is my position that the option cannot be valued at this time, or until it is actually exercised.
Any input and advise would be greatly appreciated. I can be reached at [email protected]
DennisApril 24th, 2015 at 2:30am
Hi Peter/Bruce
The reason that doesn't work for OTM/ITM options, is that by changing the Implied Vola, you effectively alter the theoretical chance the option has to get in the money...
So, for instance, by halving IV... an OTM option might already have near-zero chance to get ITM and so no value. The further OTM the option is, the sooner it will have zero value when altering IV.
For ATM call and put options, they will have no intrinsic value and their value therefore solely depends on Implied Volatility (given a certain Maturity etc).
So with ATM:
let's say IV of 24, Call value is 5, Put value is 5
IV of 12, Call value is 2.5, Put value is 2.5
IV of 0, both have zero value... (since the stock is assumed not to move and generate value for ATM options).
Cheers, Dennis
PeterJanuary 5th, 2015 at 5:13am
Hi Bruce,
No, that shouldn't be the case. I was just about to reply with that, but then checked a few scenarios using my spreadsheet to see how close it was...with the volatility at 30% an ATM option comes close to this...but OTM/ITM options are way out. Same when the vol is higher or lower than 30%. Not sure why this happens.
Did you read this somewhere or did someone else mention this to be the case?
BruceJanuary 4th, 2015 at 3:46pm
Should the option price equal the IV times the vega?
PeterMarch 4th, 2014 at 4:45am
Hi Satya,
Ah no, I only have the binomial model and the BS. If you find some good examples of the others please let me know so I can put them here too!
SatyaMarch 4th, 2014 at 3:15am
Peter,
Do you have models for the BS model only or you have them for other models like the Heston-Nandi or the Hull-White Models? If you do, could you share them? i need them for a my project.
PeterApril 26th, 2012 at 5:46pm
Ah ok, no worries, glad it worked out.
Mario MarinatoApril 26th, 2012 at 7:05am
Hi, Peter. When I entered the various possible values they all gave me the same fair price.
Asking for help on another site*, I got a hint that led me to the discovery of my mistake: my B&S formula was rounding the fair prices below 0.01 to 0.01.
Thus, with out-of-the-money options, their fair prizes where always below 0.01 given a wide range of volatilities, and my formula was returning 0.01 to all of them.
I changed the formula and everything came into place.
Thanks for your attention.
Best regards from Brazil.
* Precision & Implied Volatility
PeterApril 25th, 2012 at 10:29pm
Hi Mario,
Sounds like you're not allowing enough time to get to the right implied volatility.
What happens when you re-enter those other volatility values back into B&S...you will get a different theoretical price, right?
Mario MarinatoApril 24th, 2012 at 9:37am
Hi,
I'm developing a software to calculate the implied volatility of an option using the Black & Scholes formula and a trial-and-error method. The implied volatility values I get are correct, but I noticed that they are not the only possible ones.
For example, with a given set of parameters, my trial-and-errors lead me to an implied volatility of 43,21%, which, when used on B&S formula, outputs the price I started with. Great!
But I realized this 43,21% value is just a fraction of a much wider range of possible values (let's say, 32,19% - 54,32%).
Which value should I, then, pick as the 'best' one to show to my user?
Best regards,
PeterDecember 18th, 2011 at 3:56pm
Hi Utpaal, yes, you can use whatever price you like to calculate the implied volatility - just enter the closing prices in the "market price" field.
PeterDecember 18th, 2011 at 3:53pm
Hi JK, you can find spreadsheets for pricing American options on the binomial model page.
UtpaalDecember 17th, 2011 at 11:55pm
Thanks Peter for the excel file. Is it possible to have the implied volatility calculated based on the closing option price. I currently type the implied volatility which is not accurate. I do get accurate option closing price. Hope you can help. Thanks.
jkDecember 16th, 2011 at 7:57pm
still working on spreadsheet to price American option trading?
PeterDecember 10th, 2011 at 5:03am
You mean the multiplier? This doesn't effect the theoretical price at all - it just changes the hedge ratio, which in this case you would just multiply by 10.
MIKEDecember 9th, 2011 at 2:52pm
What happens to this formula if it takes 10 warrants to get 1 common share?
PeterNovember 2nd, 2011 at 5:05pm
Hi Marez, are you pricing a stock option or an employee stock option? Can you give me more details please? I'm not sure exactly what long term incentive payments mean in this case. How much are the payments etc?
marezNovember 1st, 2011 at 10:43pm
Hi,
Am a nuffy with this,
Used the model and have the following:
Underlying Price 1.09
Exercise Price 0.85
Today's Date 2/11/2011
Expiry Date 30/07/2013
Historical Volatility 76.79%
Risk Free Rate 4.00%
Dividened Yield 1.80%
DTE (Years) 1.74
d1 0.7900
Nd1 0.2920
d2 -0.2237
Nd2 0.4115
Call Option 0.5032
Put Option 0.2397
What does this mean on say $1m of Long Term Incentive Payments?
0ptionAddictJuly 23rd, 2011 at 11:34pm
On my iPad I simply installed office with Microsoft excel. Available on the app store.
PeterJuly 12th, 2011 at 11:48pm
Hi Paul, yes, seems that you will have to calculate Black Scholes from scratch using Apple Numbers. I've never used it before - is it a scripting language? Can you use my spreadsheet on Excel running on the iPad?
Paul SJuly 12th, 2011 at 3:57pm
Peter,
It appears that no function exists for these calculations in Apple's Numbers program. And I just don't know how to 'reverse' the B-S formula to output Implied Volatility.
I'd like to make this work in Numbers, as Excel doesn't exist on iPad and I'd like to be able to make these calculations in Numbers on that 'computer.'
The formula that doesn't work in Numbers is:
"=ImpliedCallVolatility(IF(B81="",B7,B7-B81),B12,B16/365,B5,B13,IF(B81="",B6/B7,0))"
where
B81=sum of quarterly dividends
B5=risk-free rate
B6=annualized dividend
B7=stock price
B12=call strike price
B13=call premium
B16=days to expiration
If I knew what variables to multiply, divide and add or substract to what other variables, I feel sure this would work.
For Puts the formula is:
"ImpliedPutVolatility(B9,B14,B18/365,B7,B15,B8/B9)
where
B7=risk-free rate
B8=annualized dividend
B9=stock price
B14=strike price
B15=put premium
B18=days to expiration
If this is too much to ask, I certainly understand.
-Paul
PeterJuly 11th, 2011 at 7:17pm
Hi Paul, there's no official formula for implied volatility as it's just a matter of looping through the Black Scholes Model to solve for volatility. However, if you want to see the method I have used you can check out the VBA code provided in my option trading workbook.
Paul SJuly 11th, 2011 at 10:40am
Peter,
Understanding that entering the current price of an option along with all other inputs would give us Implied Volatility, but not being a math whiz, what is the construction of the formula for Implied Volatility?
Thanks
-Paul
PeterMarch 23rd, 2011 at 7:56pm
Mmm...let me go back to my books and see what I can discover.
Bob DolanMarch 23rd, 2011 at 6:39pm
Peter wrote:
"Do you know if there is an available option model for a binary distribution...?"
Actually, the binary distribution is fully described in this web site.
The example given was a stock that had a 0.5 probability of 95 and at 0.5 probability of 105.
But your mileage may differ for a specific security.
The real question is:
How do you establish the binary points and probabilities thereof for any given security?
The answer is research.
How you link 'research' to an Excel model is an open question.
I mean, that's the fun of it.
Bob
Bob DolanMarch 23rd, 2011 at 5:59pm
Peter wrote:
"Do you know if there is an available option model for a binary distribution you mentioned?"
Well, shucks, if that option model exists, it certainly isn't easily available through a Google search.
I figure that I/we have to write it.
Hey: 'Once more into the fray'.
Wanna help?
Bob
PeterMarch 23rd, 2011 at 5:01pm
Thanks for the great comments Bob!
Your approach to finding IV by reversing Black and Scholes sounds almost the same as what I used in my B&S Spreadsheet;
High = 5
Low = 0
Do While (High - Low) > 0.0001
If CallOption(UnderlyingPrice, ExercisePrice, Time, Interest, (High + Low) / 2, Dividend) > Target Then
High = (High + Low) / 2
Else: Low = (High + Low) / 2
End If
Loop
ImpliedCallVolatility = (High + Low) / 2
Do you know if there is an available option model for a binary distribution you mentioned? Perhaps I could make a spreadsheet our of it for the site?
Bob DolanMarch 23rd, 2011 at 3:46pm
JL wrote:
"Stock prices rarely follow theoretical models however, so I suppose that is why the authors did not attempt to include any projections."
Well, sure. But also, the authors believed the 'random walk' model of stock pricing. Their skepticism of anyone's ability to forecast prices made it easy for them to embrace a model with no 'oooch' factors.
In 'The Big Short' Michael Lewis describes an analyst who adheres to 'event driven' investing. The concept is simple:
* Black-Scholes assumes a log-normal distribution of stock prices over time.
* But, sometimes, prices are determined by discrete events [law-suits, regulatory approval, patent approvals, oil discoveries]. In these cases, a binary or bipolar distribution of future stock prices is a better model.
* When future stock prices are better represented by a binary distribution, there may be probability arbitrage to be had if an option is priced assuming a long-normal distribution.
* The longer the time frame, the more likely that GBM progressions do not apply. SOMETHING will happen. If the possibility of that something can be foreseen, probability arbitrage is possible.
So, how do you quantify that?
And here I am on your web site.
Bob
Bob DolanMarch 23rd, 2011 at 3:23pm
Back to the "reversed" Black-Scholes algorithm [and sorry to find your site a year late] ...
Manually, I use a binary search to get an approximation of the IV needed to produce a given option price. It's actually a two-step process:
Step One: Guess at the IV [say, 30] and adjust the guess until you have the IV bracketed.
Step Two: Iterate a binary search -- each time making the 'guess' half-way between the brackets.
Even doing this manually, I can come up with a close approximation in a reasonable time. Iterating the search in Excel, and comparing the result to some level of 'tolerance', would seem to be a fairly easy work-around.
From a UI standpoint, I think I would specify the 'tolerance' in significant digits [e.g., 0.1, 0.01, or 0.001].
In any event, this would seem to lend itself to some sort of VBA macro.
Bob
PeterFebruary 8th, 2011 at 4:25pm
Hi JL,
Black Scholes doesn't attempt to directionally forecast the stocks price, but it does attempt to forecast the stocks price path with the volatility input.
Also, dividends are indeed incorporated into the Black and Scholes model and form part of the Theoretical Forward price. The reason that call option prices don't decrease with a change in interest rates is because the increase in the Theoretical Forward due to the stock's cost of carry (Stock Price x (1 + Interest Rate)) will always be greater than the present value of future dividends.
JLFebruary 8th, 2011 at 9:06am
Peter,
Thank you for the fast response. Your work has been very helpful in trying to understand option pricing. If I understand your explination correctly, a call option increases in price because the assumed current price of the stock will remain the same and the "Theoretical Forward Price" increases therby increasing the value of the call option. I suppose my main issue is with the Black-Scholes model itself because it makes no attempt to forecast a stocks price, which theoretically should be the present value of all the future dividends. So if interest rates are rising, the prices of stocks should be declining due to the higher discount rate used in the present value calculation, and therby decreasing the current value of the call options sold on those stocks. Stock prices rarely follow theoreticall models however, so I suppose that is why the authors did not attempt to include any projections.
PeterFebruary 7th, 2011 at 6:16pm
Hi JL,
The risk free rate is a measure of the value of money i.e. what your return would be if, other than buying the stock, you were to invest in this risk free rate. Therefore the Black Scholes Model first calculates what the Theoretical Forward price would be at the expiration date. The Theoretical Forward price shows at what price the stock must be trading at by the expiration date to prove a more worthy investment than investing in the risk free rate of return.
As the Theoretical Forward price increase with interest (risk free) rates the value of call options increases and the value of put options decreases.
JLFebruary 7th, 2011 at 4:53pm
Peter,
Keeping all other variables constant, if I increase the Risk Free Rate the value of the Call option increases. This is counter to what should happen, logically if I can earn a better return in a safer investment then the price of a higher risk investment should be lower.
PeterJanuary 23rd, 2011 at 8:01pm
That's right, they're not the same, so it's up to you what method you use.
BSJhalaJanuary 21st, 2011 at 9:30am
Hi peter,
But 4/260 and 7/365 are not same.than the results will vary for the two isn't it.
pls suggest me what will show better result.
PeterJanuary 20th, 2011 at 4:18pm
Hi BSJhala, if you want to use trading days then you can no longer reference a 365 day year; you would need to make your interval 4 / 260. Also, in the actual VBA code for Black and Scholes you would need to change the other references to a 365 day year.
ATM/OTM options will have lower market prices than the ITM options hence the price changes as a result of the delta may actually mean a larger "percentage" change in their value. For example, say ITM option has a price of 10 with a delta of 1, while an OTM option has a price of 1 with a delta of 0.25. If the market moves up 1 point, the ITM option will gain only 10% while the OTM option gains 25%. Is this what you are referring to?
The Risk Free Interest rate refers to the "cost of your money" - i.e. what rate do you need to borrow money to invest? Usually, traders just enter the current bank cash rate.
Let me know if anything is unclear.
BSJhalaJanuary 20th, 2011 at 9:06am
Dear peter,
I am not clear on your comment on time diff to be used.
Clarify If black scholes model is used and let today date is 20/jan/2011 and date of expiry is 27/jan/2011:
If normal calculation is done time should be 6/365, but trading days are 4 only than it should be 4/365 what should be used.
Also pls tell what should be risk free interest rate .
One more thing pls tell when market is running ,the option value changes frequently that time the variables that is varying should be stock price .
But why the ATM call premium is increasing than the ITM call premium where delta value is close to 1.
What is causing the ATM/OTM calls to changing more than ITM call.
Correct me if I am wrong anywhere
PeterJanuary 19th, 2011 at 4:44pm
If it is the standard Black and Scholes Model then you would use calendar days as the formula will use 365 in the calculations. You can, however, modify the formula yourself and use your own trading day calendar of days.
The likely reason for the difference between your calculated prices and the actual prices is the volatility input that you use. If your volatility input into the model is based on historical prices and you notice that the actual option prices are higher than your calculated prices then this tells you that the market "implied" volatility is higher than the historical; i.e. that the professionals expect volatility to be at higher than historical levels. But, it could also mean that your other parameter inputs are not correct, such as Interest Rates, Dividends etc.
Your best bet at deriving the prices more closely, assuming all the other inputs are correct, is to change the volatility input.
BSJhalaJanuary 19th, 2011 at 11:05am
What should be the time(in years).
Should it be simply the date difference between today date and expiration date. Or it should be the trading days difference between today and expiration date.
Why actual prices are different from calculated prices.
How can we derive the prices closely .
PeterDecember 5th, 2010 at 5:03pm
Thanks for the feedback Tony!
For the expiration...if you want the Friday to be counted in the valuation of the option then you need to enter the Saturday as the expiration date when using Excel. This is because if you enter Friday's date and then this date is subtracted from today's date the last day is not included in the time calculation.
i.e. 27th - 26th = 1 day. Although in trading terms there are actually two days of trading left.
Know what I mean?
TonyDecember 4th, 2010 at 11:19am
I've working with both your historical volatility and Black Scholes sheets. Thank you for these tools. They are well written, very fast and I sincerely appreciate your level of technical detail.
1. What date should be used for option expiration?
The Friday date or the Saturday date? For example expiration dates are currently 12/17/2010 for Friday and saturday when all is settled is 12/18/2010.
PeterOctober 13th, 2010 at 12:44am
Yes, you just set the Dividend Yield to the same value as the Interest Rate. This will make the forward price used for the calculation the same as the base price but still use the Interest Rate to discount the premium.
PaulOctober 12th, 2010 at 8:05pm
Does this spreadsheet correctly price options on european futures?
thx
PeterSeptember 30th, 2010 at 11:08pm
Not yet - but working on it...
GricSeptember 30th, 2010 at 9:33pm
Do you have the "Binomial Option Model" for American Style Options somewhere?
PeterApril 8th, 2009 at 7:05am
Hi Helen,
You can see my code in the spreadsheet:
https://www.optiontradingtips.com/pricing/free-spreadsheet.html
I've not seen a "reversed" Black-Scholes formula yet. If you find one...please let me know and I'll add it to the pricing spreadsheet.
HelenApril 7th, 2009 at 2:53pm
What will be the best way to calculate the implied volatility on options. Doing the backward of the Black-scholes model?
AdminMarch 22nd, 2009 at 6:36am
For American style options you would use the Binomial option pricing model. My spreadsheet currently doesn't price American options...only European options. I plan to add a Binomial model soon.
JTMarch 18th, 2009 at 8:08am
One more question. From reading your site, which is fantastic by the way, it seems that this "pricing" strategy is mainly used for Euro style options. What source of pricing model would you use for American style options?
AdminMarch 18th, 2009 at 4:43am
Hi JT,
Yes, "theoretically" it would be a good price to buy.
JTMarch 17th, 2009 at 12:53pm
Stupid question. Is the theoretical price that is calculated using this method, the "max" price you should purchase this option at? Say the option price was 1.30 for a call with a strike of 2.50 and the theoretical price is 1.80. Would that make it a "good" buy?
AdminFebruary 1st, 2009 at 3:45am
Hi Hadi,
Yep, I agree. I've corrected the paragraph as noted.
Thanks!
Hadi AKJanuary 31st, 2009 at 12:53am
" The volatility of an option really determines how likely that contract will be in, at or out-of-the-money by the expiration date. "
4th Paragraph above the Google Ads, last line.
The volatility referred by those academics was the volatility of the underlying stock not the volatility of the option itself,
The price of an option is derived fully from the underlying stock and its provisions ( Strike Price , Maturity , Underlying Price, Int Rate and Volatility OF THE UNDERLYING STOCK )
Nice Webpage i use it frequently,
Rgds
H.A.K.
Add a Comment