Expiration Summary 15th July, 2016
Total P&L was up $47. I took positions in 12 stocks.
| Trade | Open | Days | P&L |
|---|---|---|---|
| WLL Long Put | 8-Jun-16 | 16 | 300 |
| ATVI Put Spread | 2-Jun-16 | 43 | -126 |
| CY Long Call | 2-Jun-16 | 43 | -42 |
| GOGO Long Put | 6-Jun-16 | 39 | -124 |
| VLO Long Put | 6-Jun-16 | 39 | -100 |
| RBS Long Call | 8-Jun-16 | 37 | -120 |
| PBI Long Call | 9-Jun-16 | 36 | -100 |
| GGAL Long Call | 9-Jun-16 | 36 | 60 |
| MT Long Call | 9-Jun-16 | 36 | -110 |
| PLD Long Call | 9-Jun-16 | 36 | 90 |
| VIAV Covered Call | 22-Jun-16 | 30 | 258 |
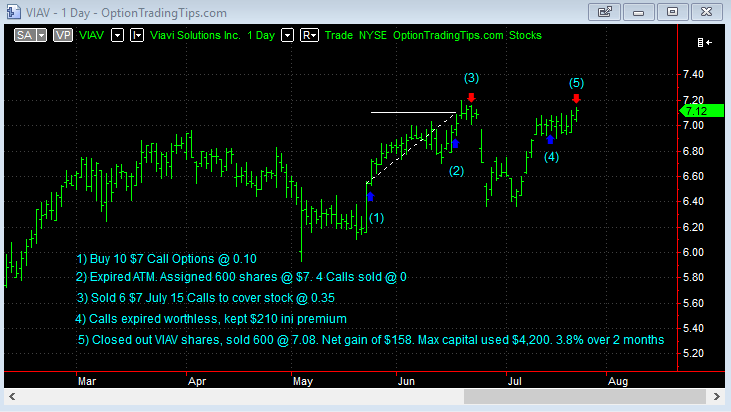
VIAV Long 10 $7 Calls
This is a great example of turning a losing long call trade into a profitable trade by writing calls against my long stock assignment.
| Stock | VIAV |
|---|---|
| Position | Long Call + Covered Call |
| Trade Length | 30 Days |
| Capital | $4200.00 |
| P&L | $258.00 |
Trade Open: May 24th
Bought 10 VIAV $7 calls @ 0.10, $100 in total premium.
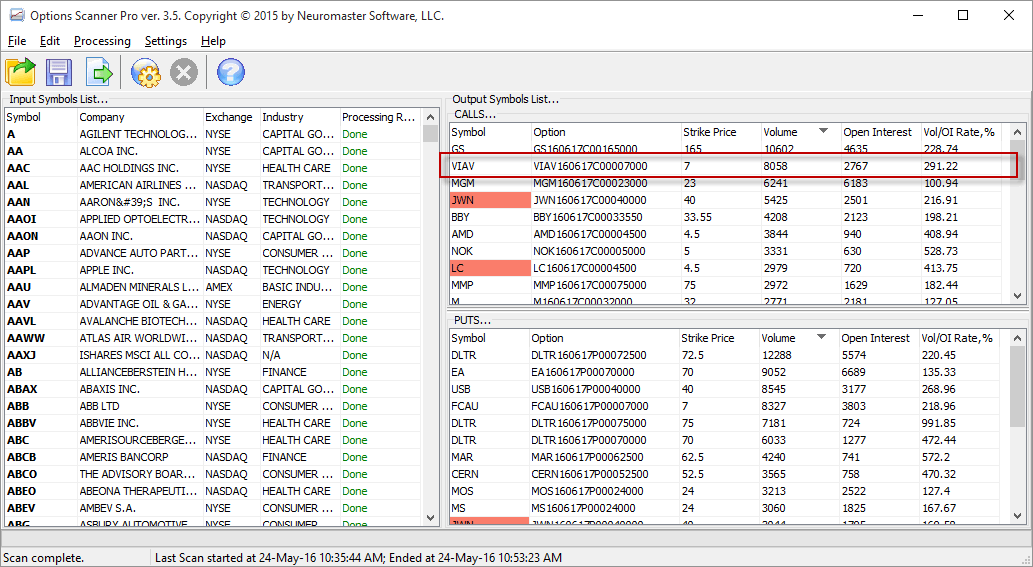
Option Scans for the 23rd May
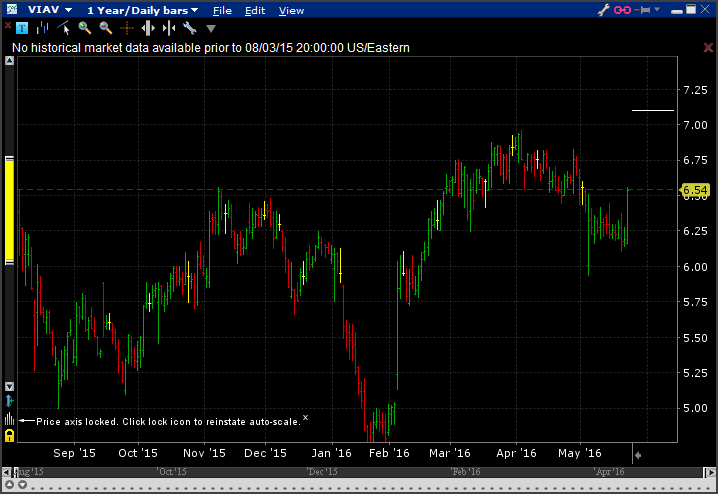
VIAV Chart for the 23rd May
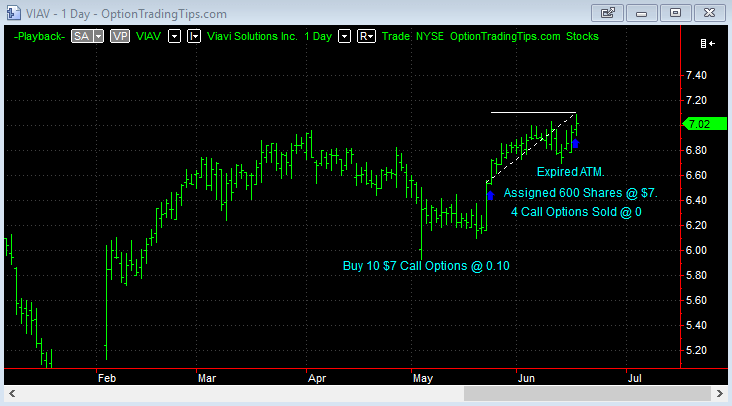
Update: 17th June
My initial long calls have now turned into a Covered Call.
VIAV closed on Friday the 17th @ $7.02. I was long 10 call options. 6 of those calls were assigned to stock, which means I am long 600 shares of VIAV stock at a purchase price of $7. The premium I paid for the options is lost so I've now effectively paid $6.90 per share.
In response, on the 22nd June I sold 6 July 15 $7 call options @ 0.35 each, taking in $210 in premium.
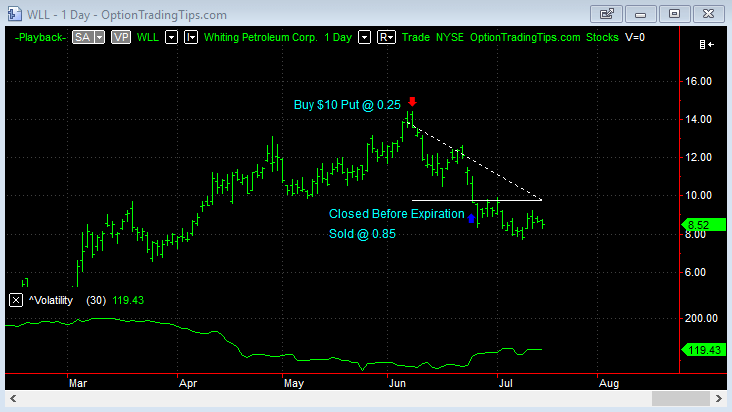
WLL Long 5 $10 Puts
I closed WLL early on the 24th June, selling back the puts @ 0.85 for a $300 profit. If I had left the trade until expiration I would have made an ADDTIONAL $315!
| Stock | WLL |
|---|---|
| Position | Long Puts |
| Trade Length | 16 Days |
| Capital | $125.00 |
| P&L | $300.00 |
Trade Open: June 8th
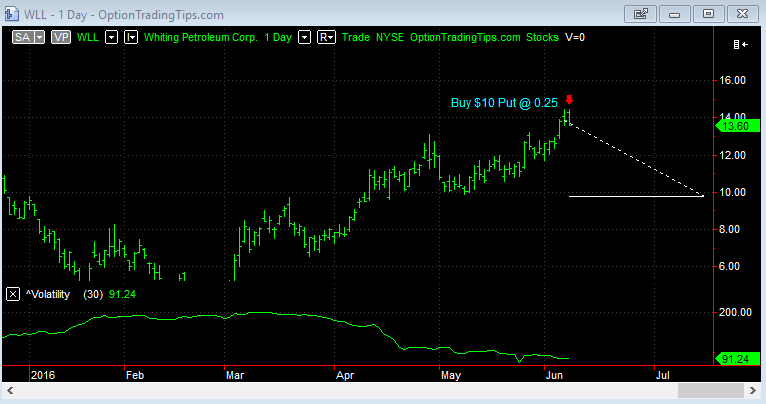
I bought 5 $10 puts @ 0.25.
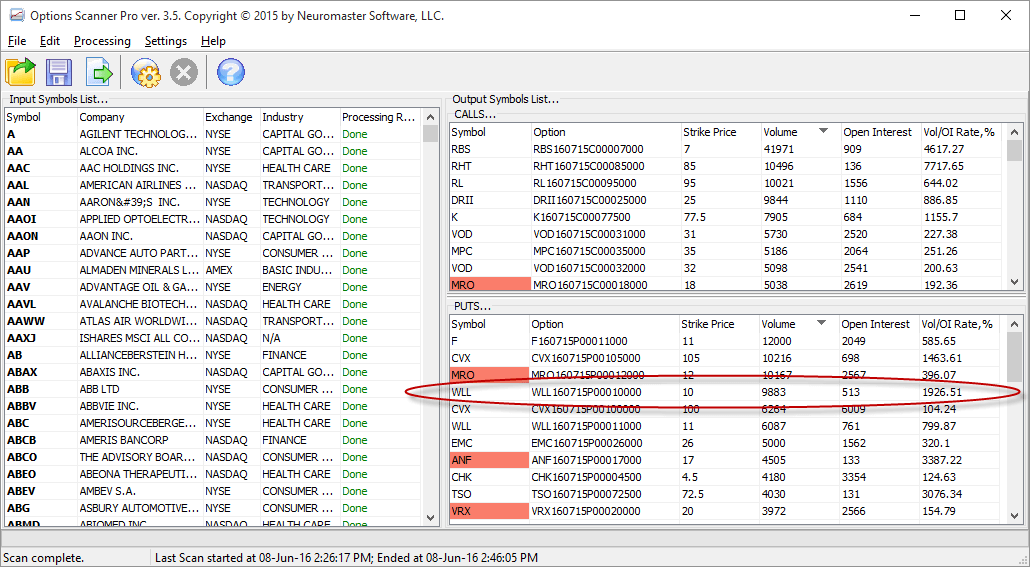
Option Scans for the 7th June
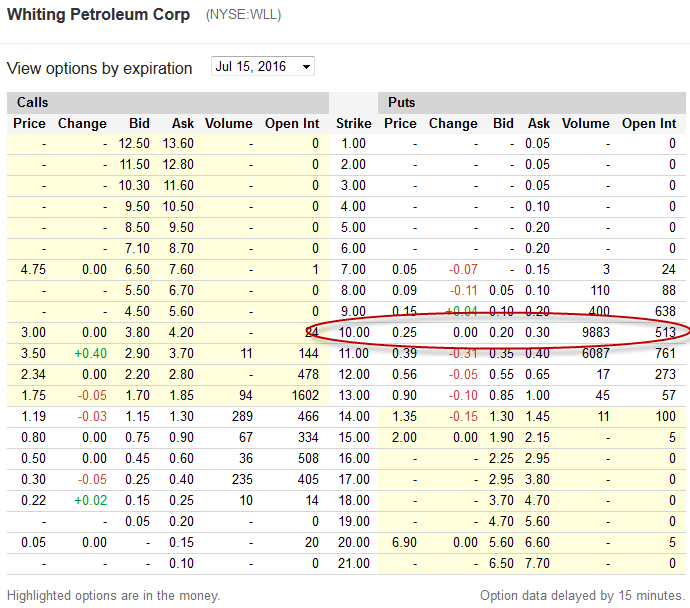
WLL Option prices for the 7th June
ATVI Long $38 / $36 Put Spread
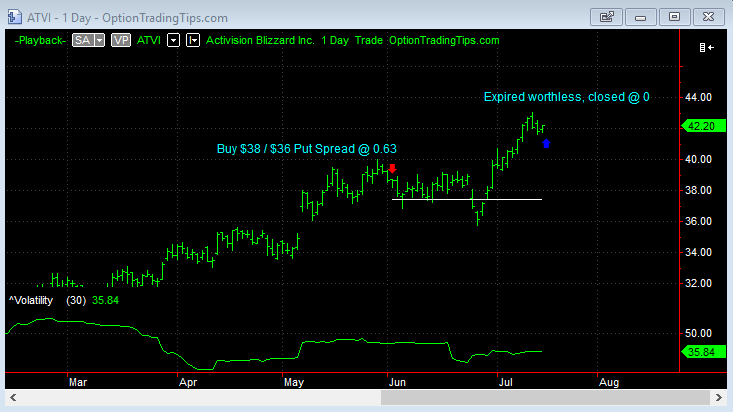
| Stock | ATVI |
|---|---|
| Position | Long Put Spread |
| Trade Length | 43 Days |
| Capital | $126 |
| P&L | -$126.00 |
Trade Open: June 2

The $36 puts showed up on the alert list trading 20,060 times over 5,818 in open interest. However, when I looked up the options about an hour before the US market open, the open interest had changed for the puts. I suppose the open interest updates with the volumes for that day or perhaps there are off-market trades to be included. Anyway, I see that the $36 and $38 puts have significant volumes going through...perhaps 20,000 put spreads?
I was conflicted with this one as I see that the $42 calls in the same expiration also traded 20,000 times. So, there is interest both sides, but more weight to the downside according to the put volumes.
Plus, I have an order to go long a similar stock in $CY so I decided to keep a short position with this stock and hence went with the put spread.
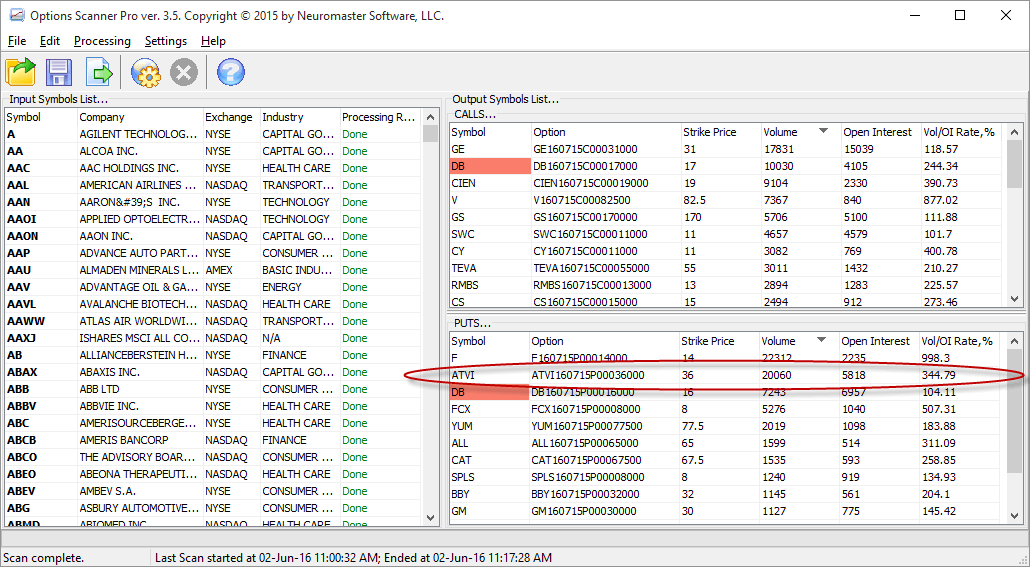
Option Scans for the 1st June
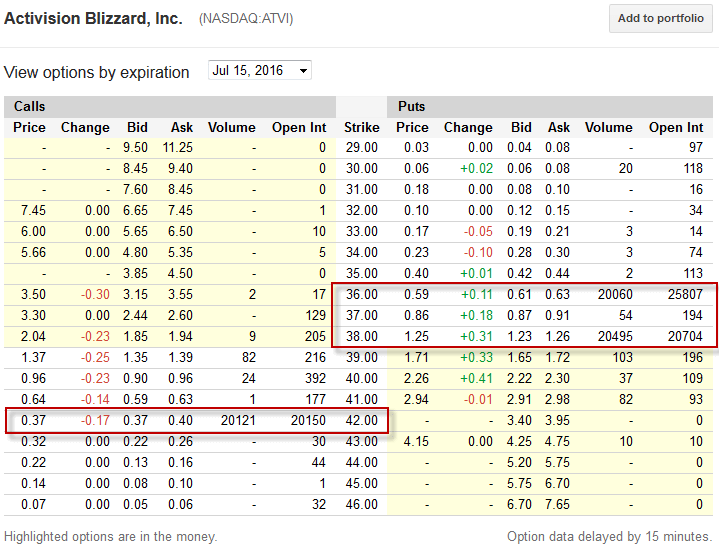
ATVI Option prices for the 1st June
CY Long $11 Calls
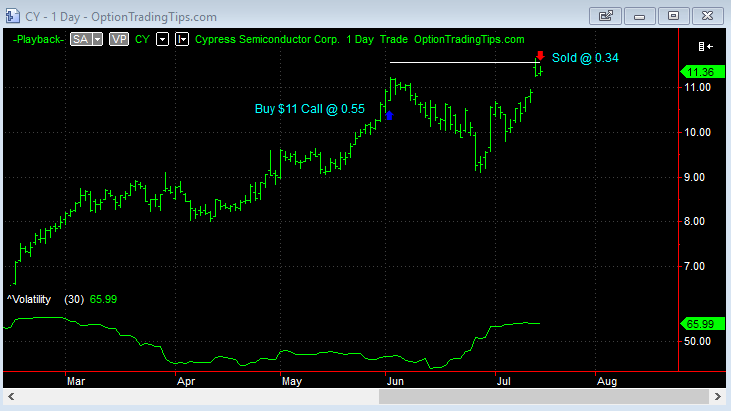
| Stock | CY |
|---|---|
| Position | Long Call |
| Trade Length | 43 Days |
| Capital | $110.00 |
| P&L | -$42.00 |
Trade Open: June 2nd
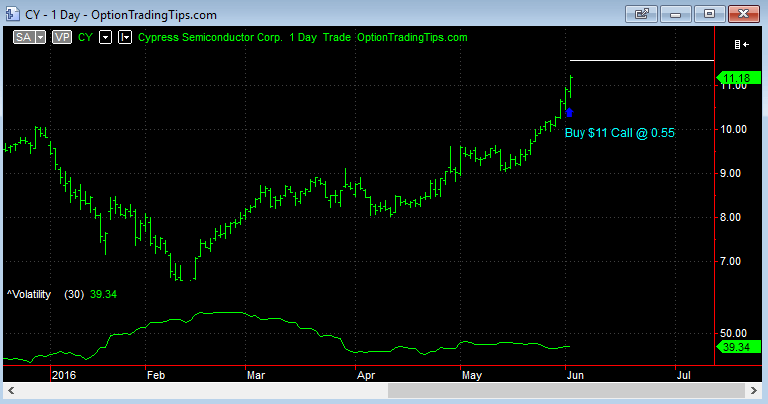
The July expiry had 3,082 over 769 in open interest for the $11 strike price in $CY so I bought 2 calls @ 0.55.
But when I look at the option prices I see that the $12 strike as a massive 17,820 trade over 14,524!
The $12 strike looks too far for my liking so I stuck with the $11 calls.
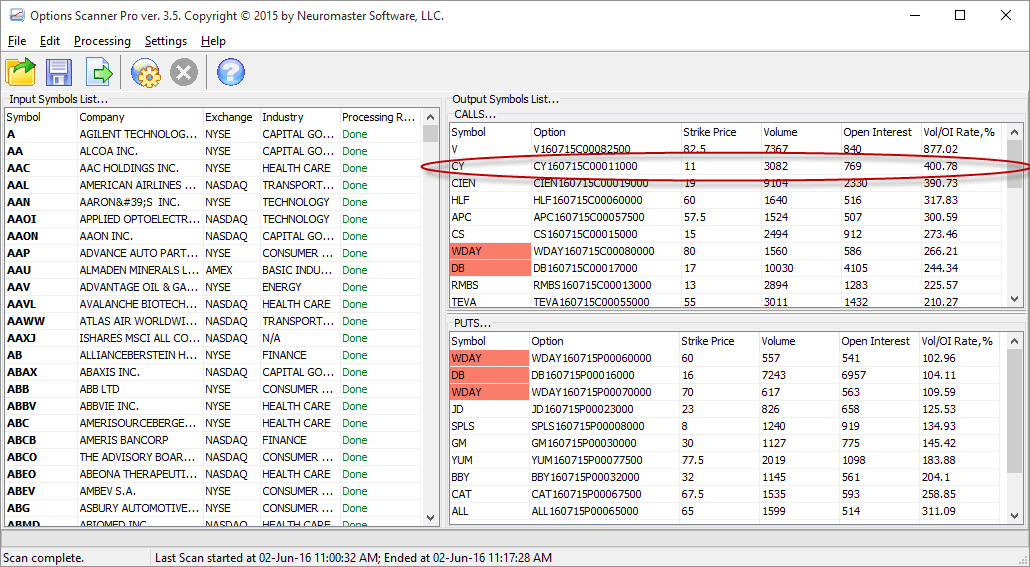
Option Scans for the 1st June
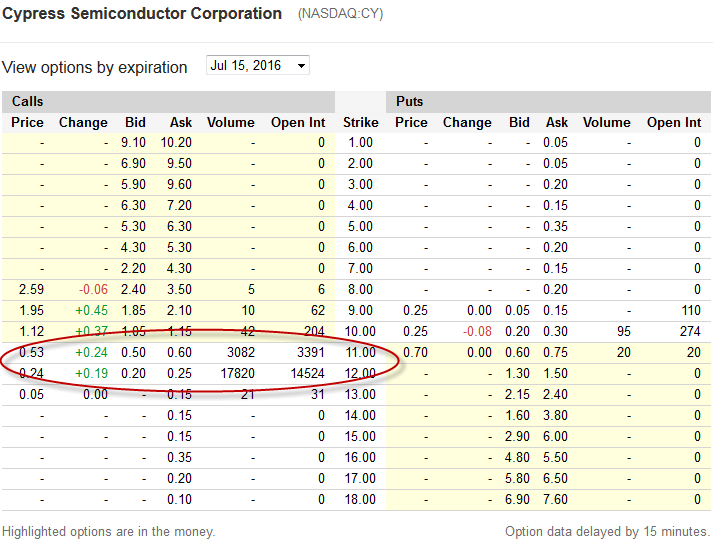
CY Option prices for the 1st June
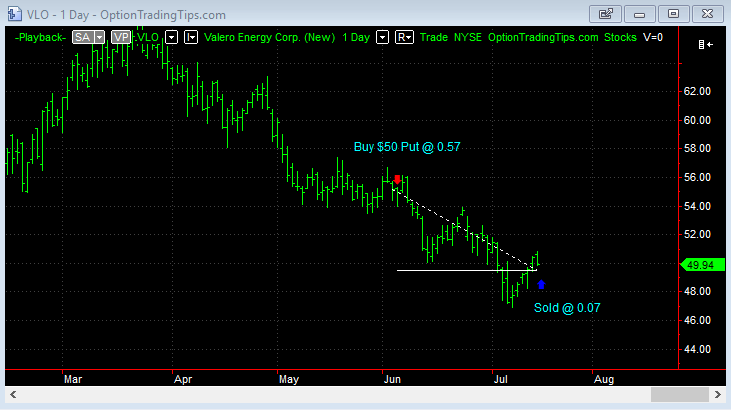
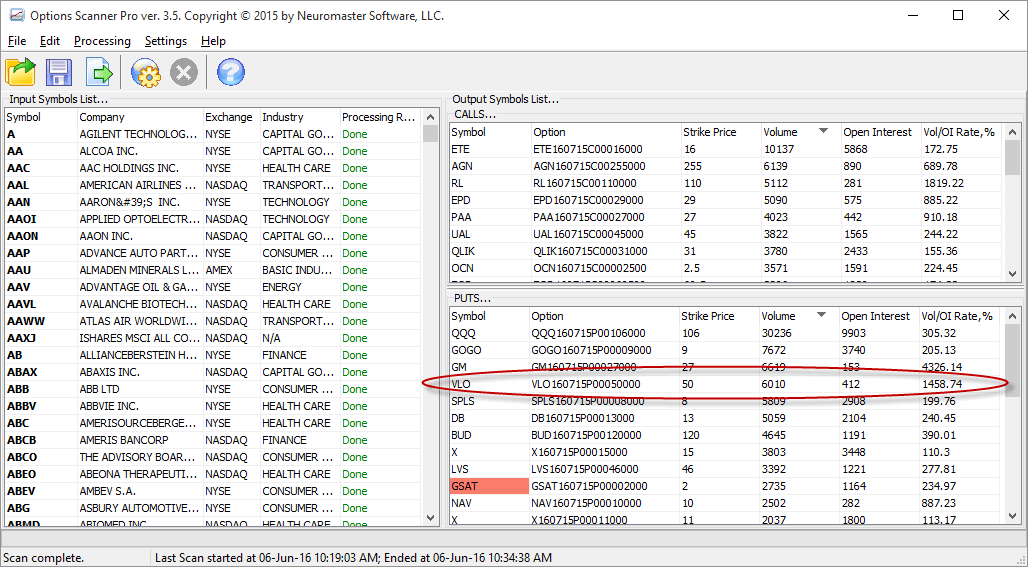
VLO Long 2 $50 Puts
| Stock | VLO |
|---|---|
| Position | Long Put |
| Trade Length | 39 Days |
| Capital | $114.00 |
| P&L | -$100.00 |
Trade Open: June 6th
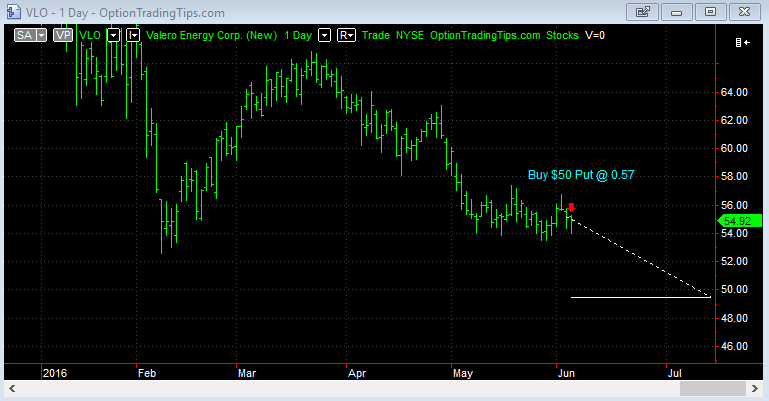
3rd of June (Friday) scans showed 6,010 options of the $50 puts over 412 in open interest. I have a few existing call positions so I am looking to get long some puts.
I bought 2 puts @ 0.57.
Option Scans for the 3rd June
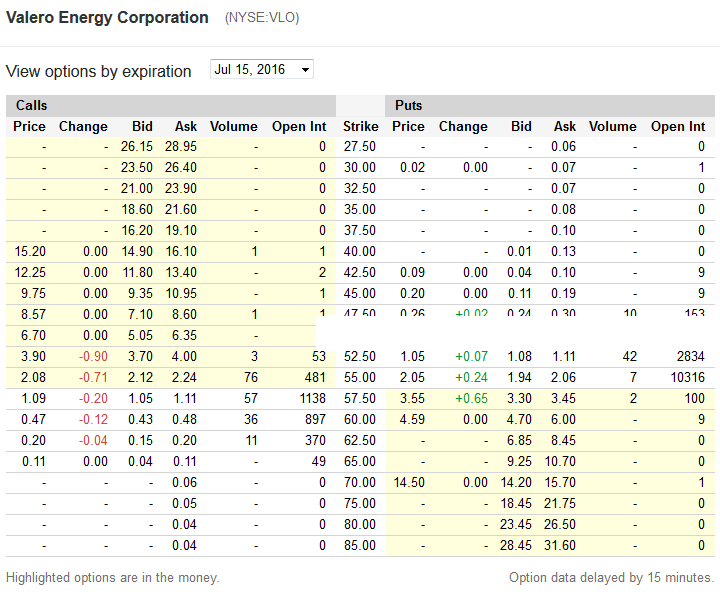
VLO Option prices for the 3rd June
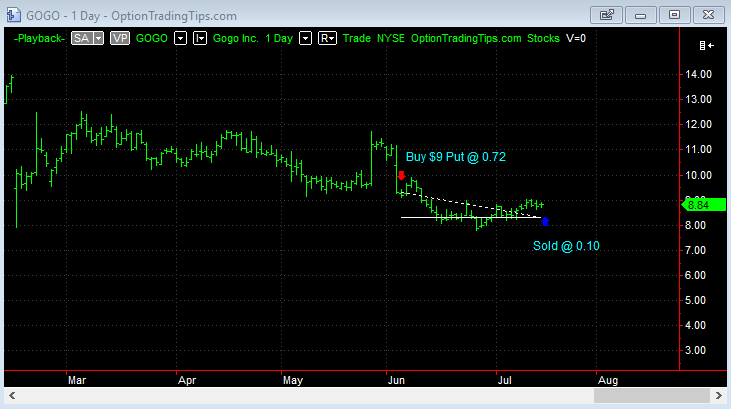
GOGO Long 2 $9 Puts
| Stock | GOGO |
|---|---|
| Position | Long Put |
| Trade Length | 39 Days |
| Capital | $144.00 |
| P&L | -$124.00 |
Trade Open: June 6th
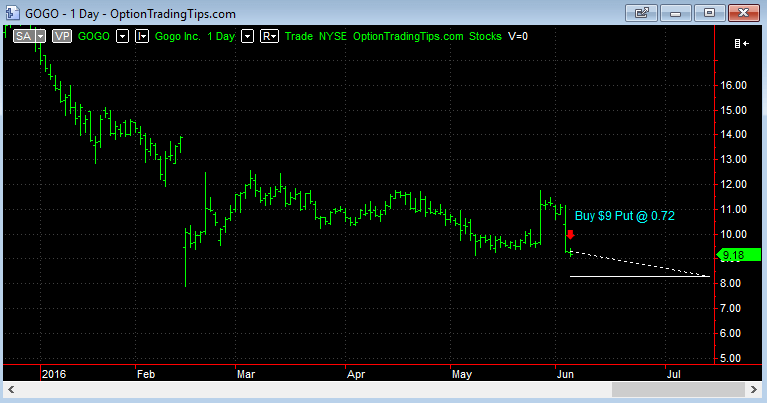
3rd of June (Friday) scans showed 7,672 traded in the $9 puts over 3,740 in open interest.
I bought 2 $9 puts @ 0.72.
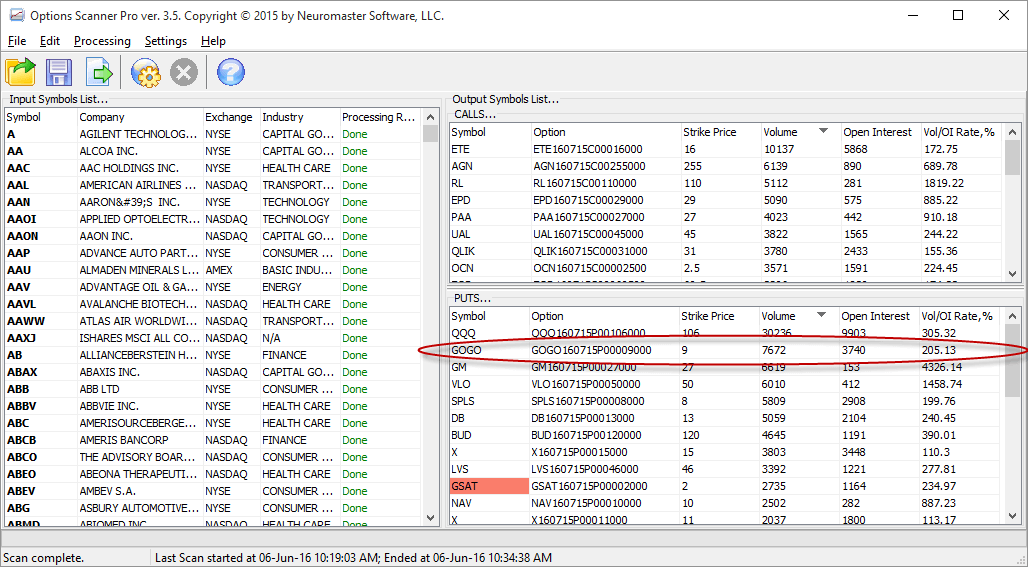
Option Scans for the 3rd June
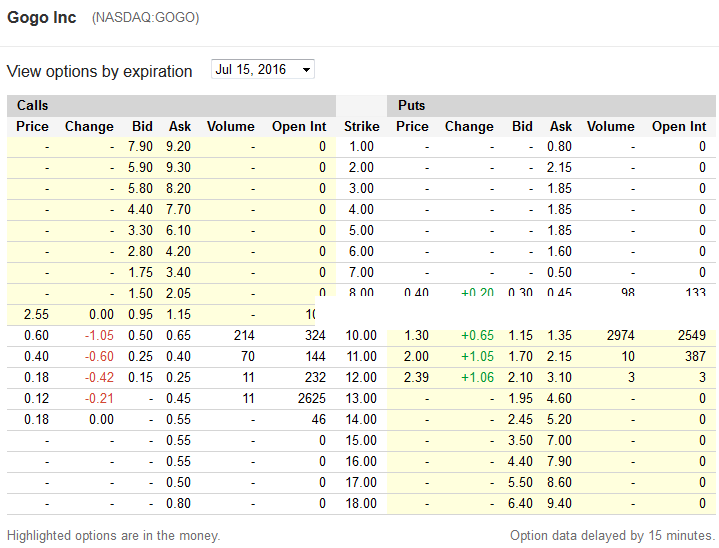
GOGO Option prices for the 3rd June
RBS Long 4 $7 Calls
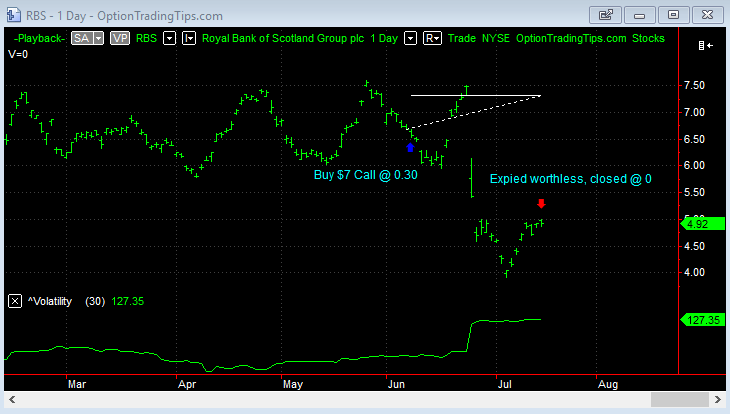
| Stock | RBS |
|---|---|
| Position | Long Call |
| Trade Length | 37 Days |
| Capital | $120.00 |
| P&L | -$120.00 |
Trade Open: June 8th
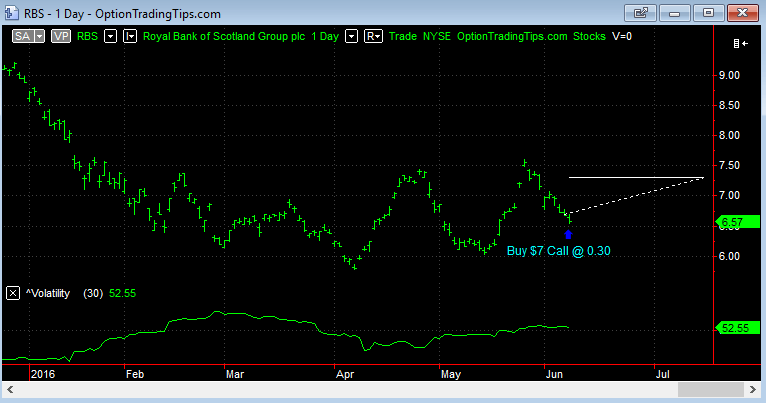
I bought 4 $7 puts @ 0.30.
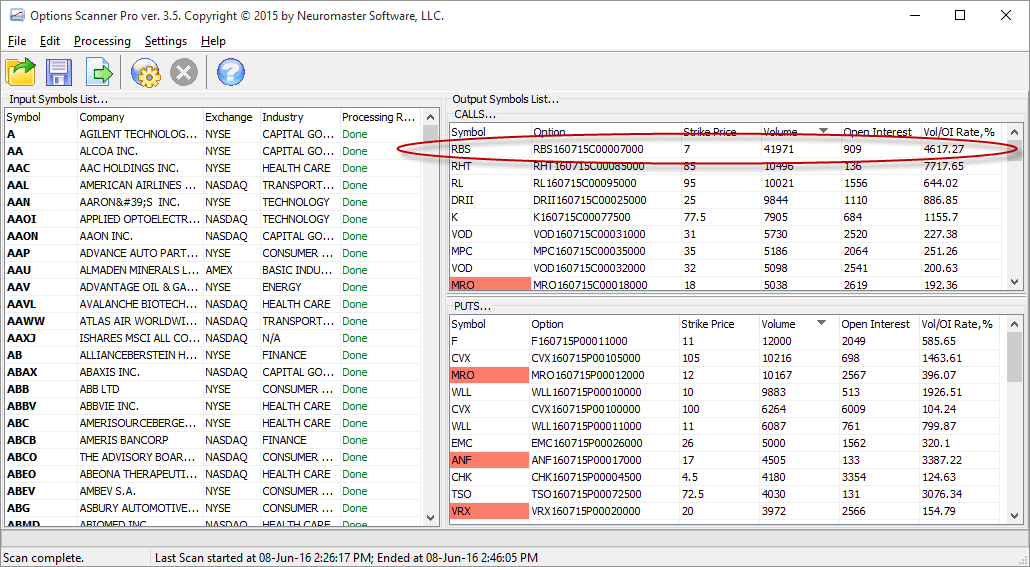
Option Scans for the 7th June

RBS Option prices for the 7th June
PBI Long 5 $20 Calls
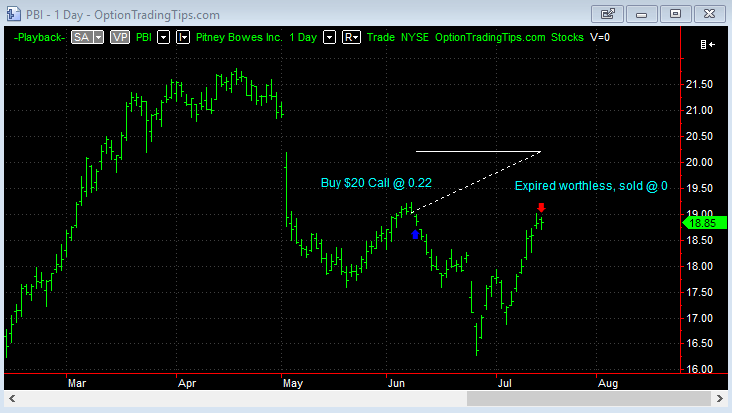
| Stock | PBI |
|---|---|
| Position | Long Cal |
| Trade Length | 36 Days |
| Capital | $100.00 |
| P&L | -$100.00 |
Trade Open: 9th June, 2016
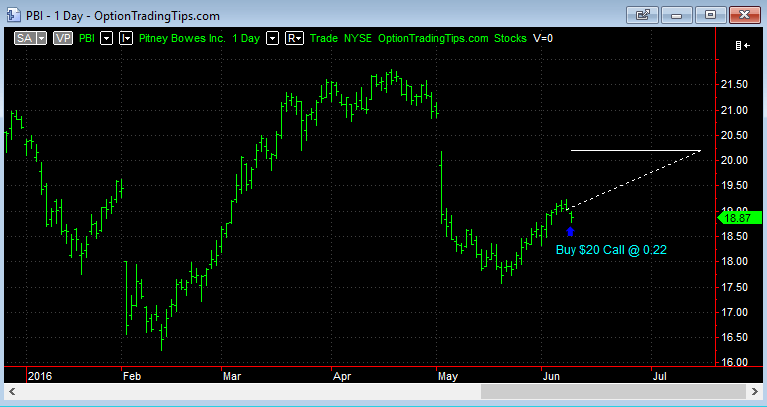
Bought 5 July $20 calls @ 0.20.
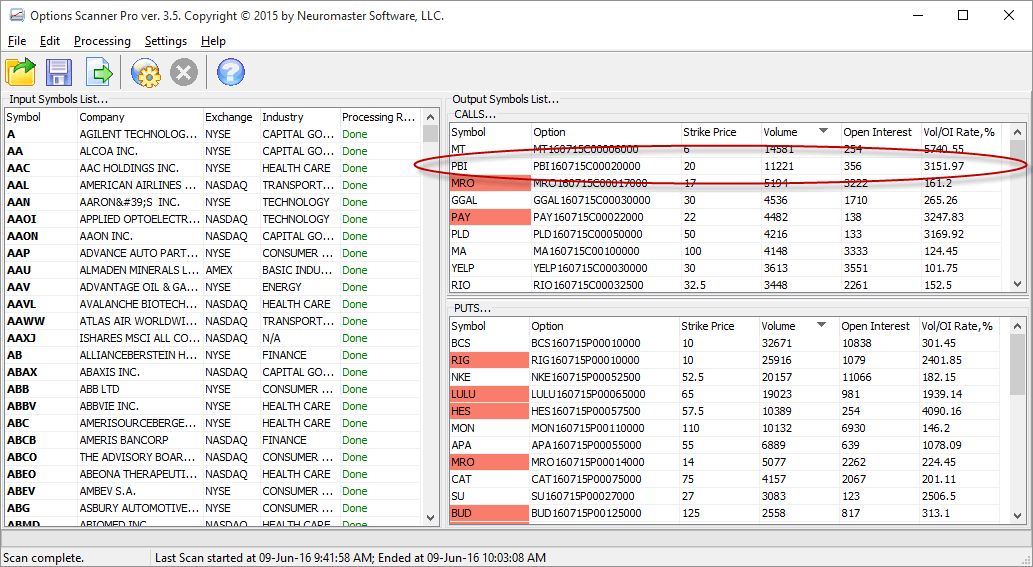
Option Scans for 8th June, 2016
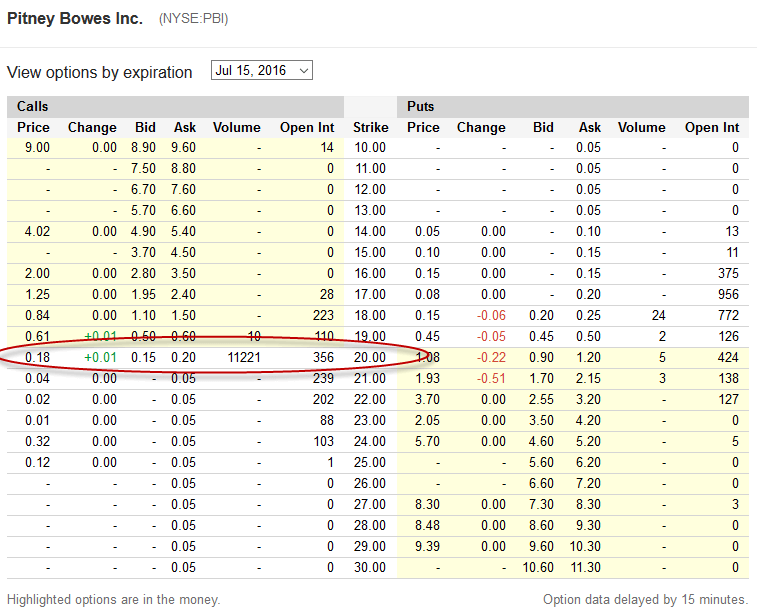
Option Prices for 8th June, 2016
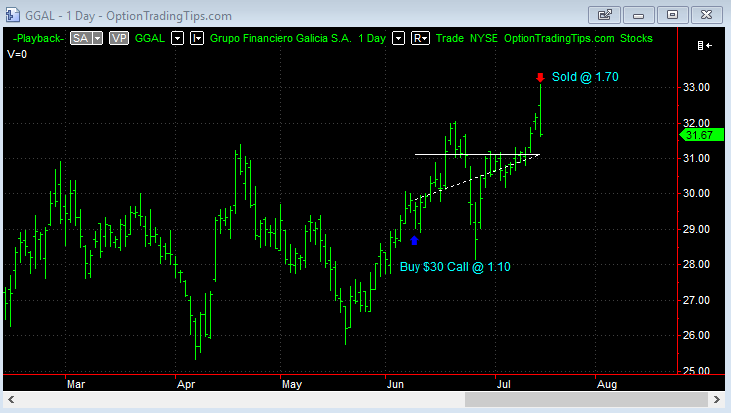
GGAL Long 1 $30 Call
| Stock | GGAL |
|---|---|
| Position | Long Call |
| Trade Length | 36 Days |
| Capital | $110.00 |
| P&L | $60.00 |
Trade Open: 9th June, 2016
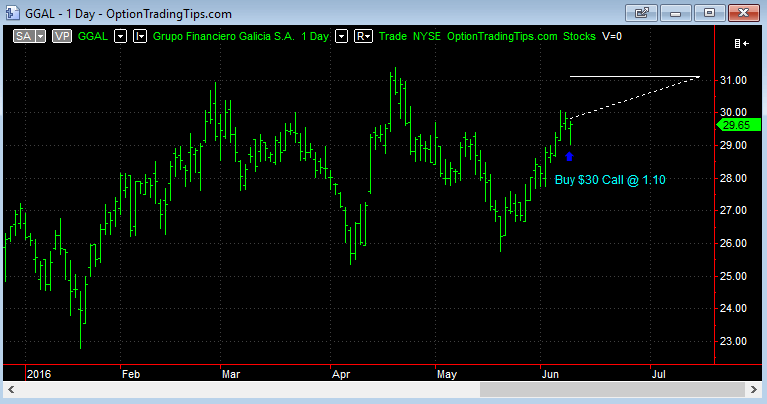
Bought 1 $30 call option @ 1.10.
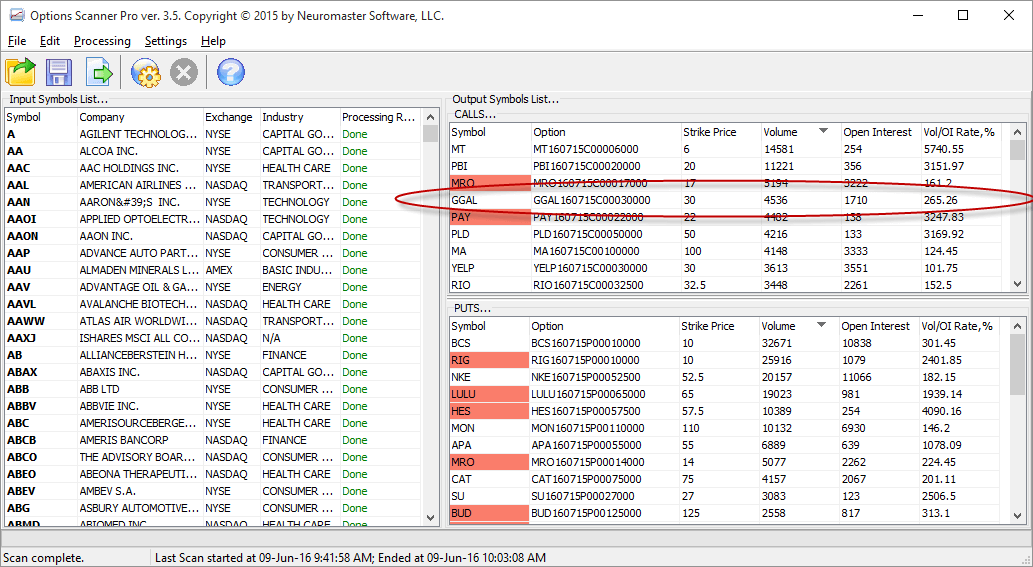
Option Scans for 8th June, 2016
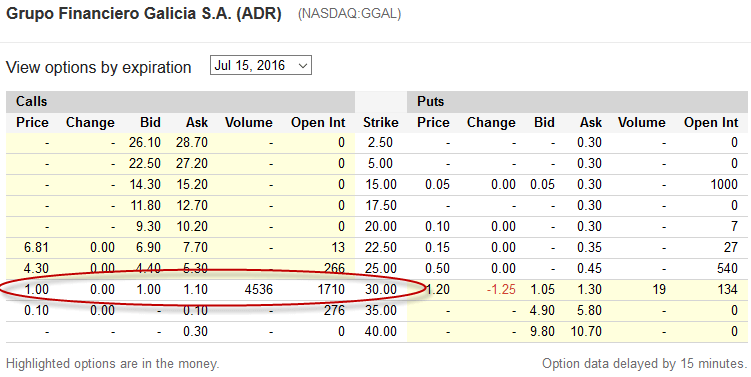
Option Prices for 8th June, 2016
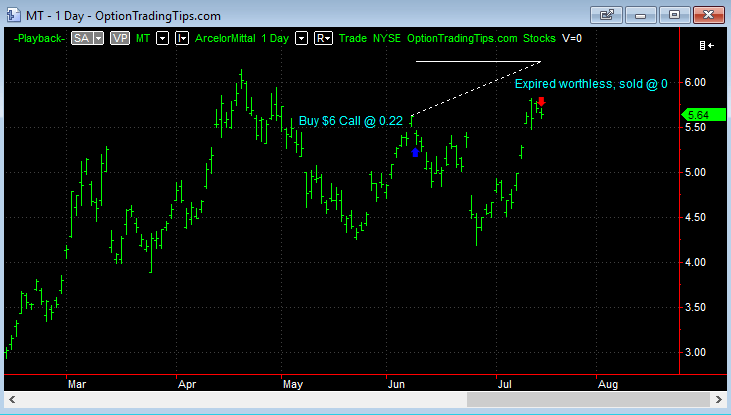
MT Long 5 $6 Calls
| Stock | MT |
|---|---|
| Position | Long Calls |
| Trade Length | 36 Days |
| Capital | $110.00 |
| P&L | -$110.00 |
Trade Open: 9th June, 2016
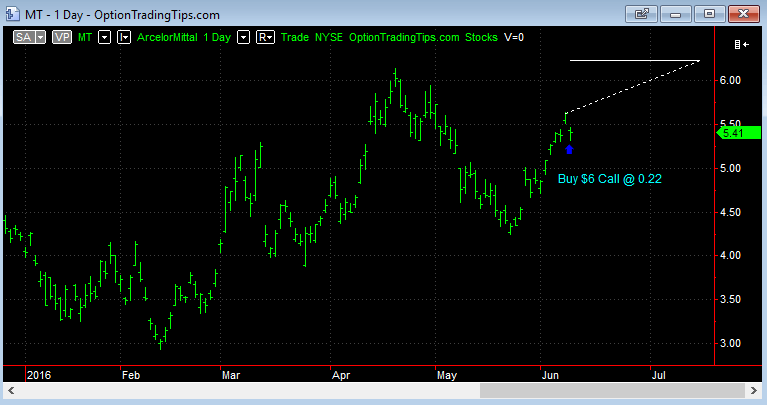
Bought 5 July $6 call options @ 0.22.
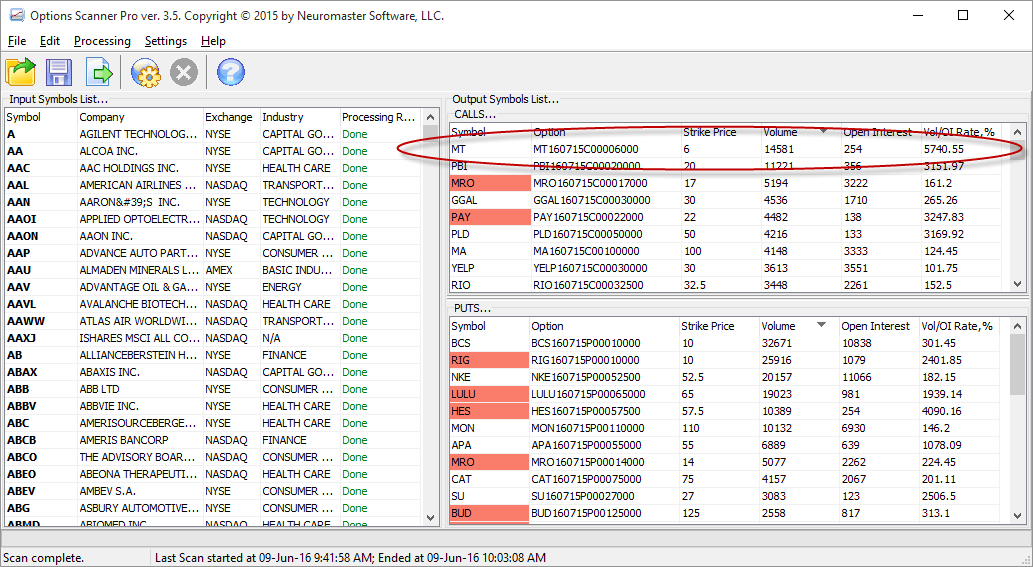
Option Scans for 8th June, 2016
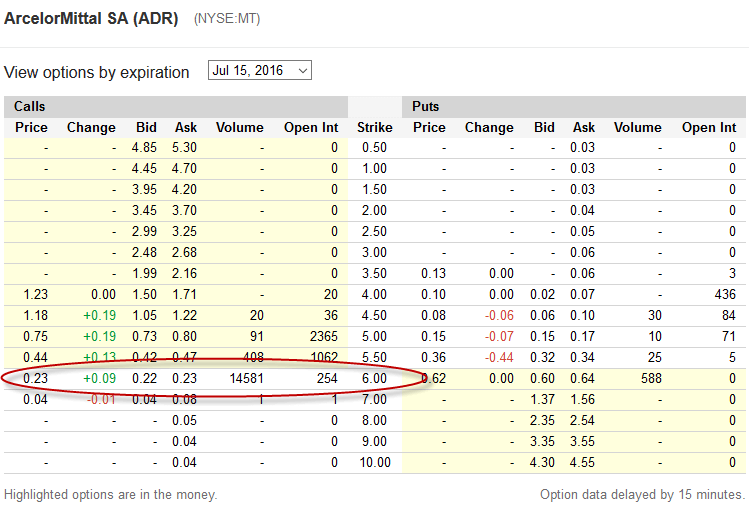
Option Prices for 8th June, 2016
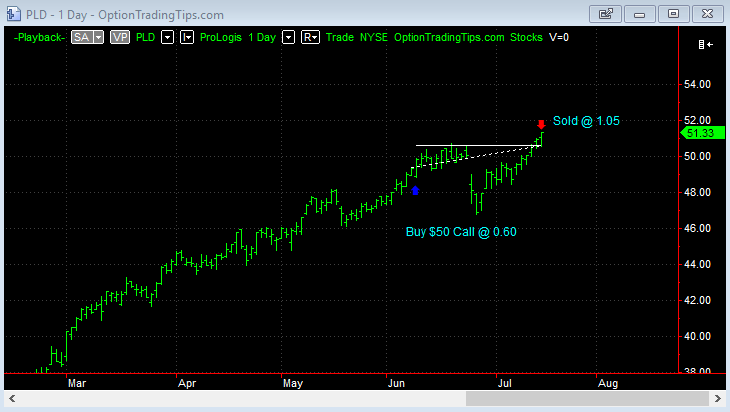
PLD Long 2 $50 Calls
| Stock | PLD |
|---|---|
| Position | Long Calls |
| Trade Length | 36 Days |
| Capital | $120.00 |
| P&L | $90.00 |
Trade Open: 9th June, 2016
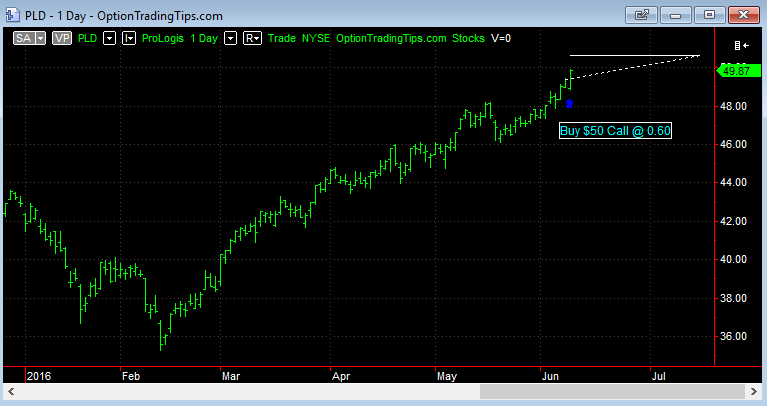
Bought 2 July $50 call options @ 0.60.
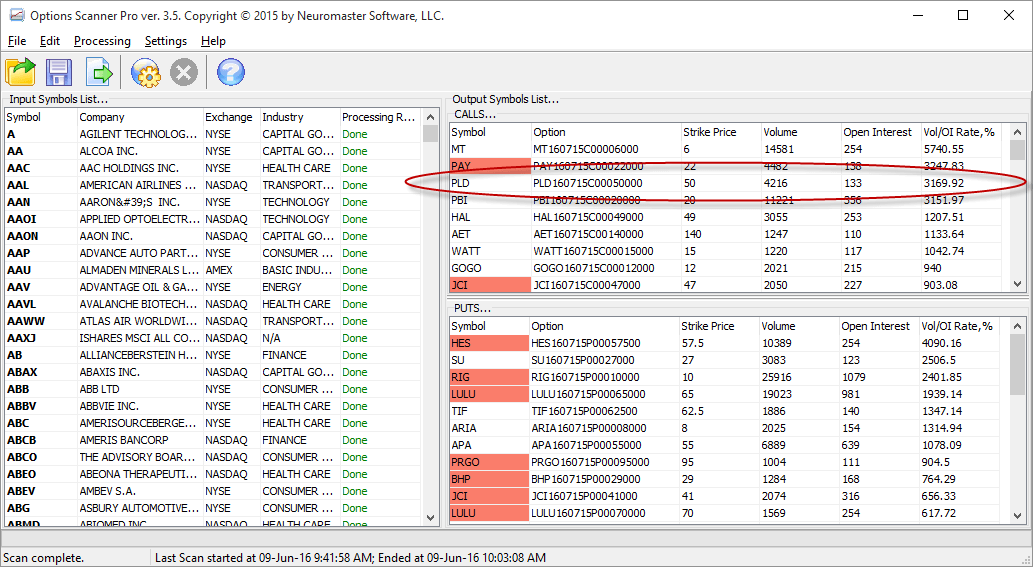
Option Scans for 8th June, 2016
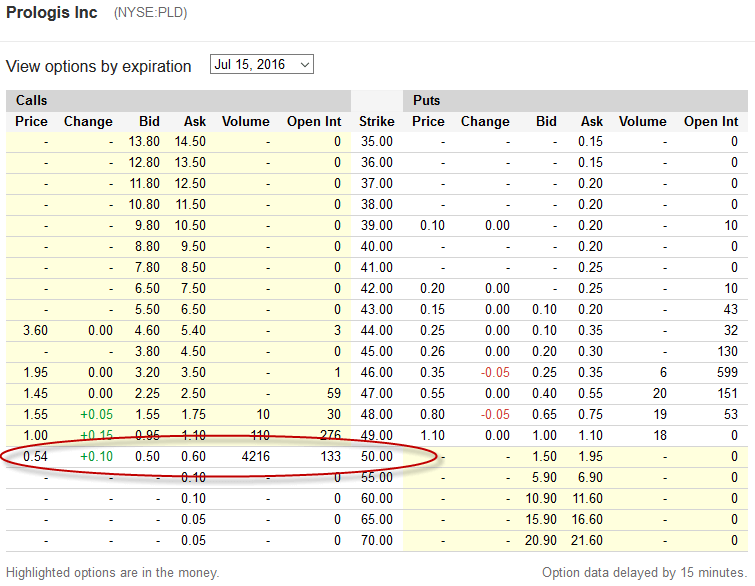
Option Prices for 8th June, 2016
There are zero comments
Add a Comment