Trade 4 - 13th July 2005 (Closed)
Last updated 13th September 2005
Strategy: 2 Time Spreads
Underlying: US 30 Year Treasury Bond Futures
Closed Position as at 13th September 2005
Long 1 September 123 Call Option @ 0.03 Expired worthless (-0.03)
Short 1 December 123 Call Option @ 0.19 Now trading at 0.06 (+0.13)
Long 1 September 110 Put Option @ 0.06 Expired worthless (-0.06)
Short 1 December 110 Put Option @ 0.31 Now trading at 0.08 (+0.23)
Net profit of 27 ticks, or $421.88 (25.27% ROI)
Background and Trade Setup
For this trading example, we are going to trade options on the US 30 Year Bond Futures (CBOT). Note that the contract size for US 30 Year options is $100,000 and the tick size traded for these contracts is in 64ths. That is, each '01 tick represents a dollar move of $15.625.
The strategy is based of another trade example by David Rivera of Delta Neutral Trading (link removed as site no longer active). Dave puts an interesting twist on Time Spreads (also known as a Calendar Spread).
When putting on time spreads, option traders often say it is a good idea to sell the front month option (and buy the back month option) in an attempt to take advantage of time decay. This method makes a lot of sense because options are, after all, a decaying asset and loose their value very quickly as expiration approaches.
But Dave suggests that the best way to compare options in different expiry months is to look at their "cost per day".
I am on the Delta Neutral Trading (link removed as site no longer active) mailing list and have just received another trading tip from Dave. Here is what was in the email:
I was doing my search for option inconsistencies and here is what I found.
I am looking at how much an option costs per day compared to an option from a different month in the same futures market.
September T-Bond futures contract closed at 116-20
December T-Bond futures contract closed at 116-07
September T-Bond options have 45 days left until expiration.
December T-Bond options have 136 days left until expiration.
Sep. T-Bond 123 Call options settled at -03 (3 ticks).
Dec. T-Bond 123 Call options settled at -21 (21 ticks).
The Dec. 123 Call is 7 times more expensive than the Sep. 123 Call, but it ONLY has 3 times more time left.
Sep. T-Bond 110 Put options settled at -05.
Dec. T-Bond 110 Put options settled at -31.
The Dec. 110 Put is 6.2 times more expensive than the Sep. 110 Put, but it ONLY has 3 times more time left.
When putting on any calendar spread, buy the cheaper cost per day options and sell the more expensive.
Even if you are not putting on a spread, this is a great way to choose which option to buy or sell.
Let's put this trade on and see how it goes.
For free delayed futures prices a great site is FutureSource.
I received Dave's trade tip a day late so my prices are a little different to the prices Dave shows. Here are our option positions at the prices that were quoted when I checked the market:
Long 1 September 123 Call Option @ 0.03
Short 1 December 123 Call Option @ 0.19
Long 1 September 110 Put Option @ 0.06
Short 1 December 110 Put Option @ 0.31
When you put two time spreads together like, you might notice that you actually have two strangles: long a 123/110 September strangle and short a 123/110 December strangle. Looking at Dave's trade suggestion in this way helps get a better perspective of our risk.
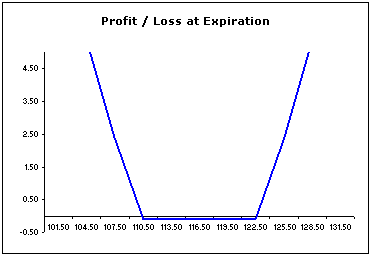
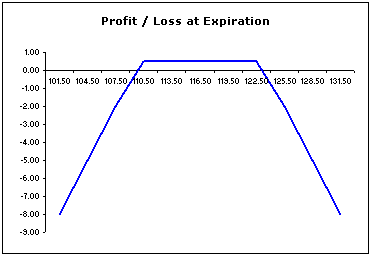
Here are the two payoff diagrams of these two spreads that I generated using the Option Trading Workbook.
Long 123/110 September Strangle.
Short 123/110 December Strangle.
Given that we are long the front month (September) strangle, our maximum risk is the amount we paid for the spread i.e. 0.09 ticks ($140.63), and we break even when the future trades below 109 29/32 or trades above 123 3/32.
For the short strangle we start losing money when the future trades below 109 16/32 or trades above 123 16/32.
If the market starts to race away in either direction, our front month options should increase in value faster than the back month as they are more sensitive to price changes.
Let's see how the trade goes.
Update - 15th July 2005
Not much has happened in total with our two spreads since we put on the trade despite the T-Bonds making a nice downward move.
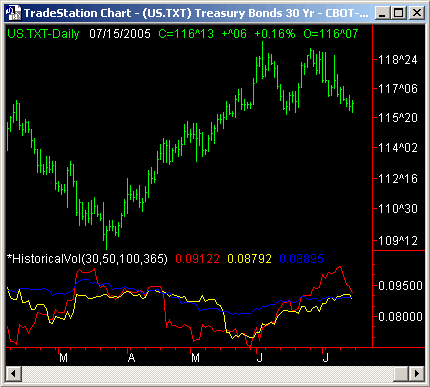
We still have made an unrealised gain of 1 tick or $15.63, but the recent move wasn't enough to really move our option position. What we need is for volatility to rise substantially in the short term, which will increase the value of our short term options more than the longer dated options.
As you can see from the above chart, short term (30 day) realised volatility has made a very sharp move down from 10.37% last Friday to 9.12% today.
To be continued...
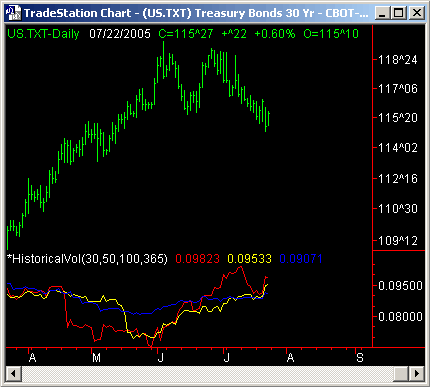
Update 22nd July
September T-Bonds continued their decline this week to close at 115^27 and 30 day volatility popped up slightly to 9.80%. Although an increase in volatility should help our positions, the move wasn't really great enough to get excited about.
Our P&L is now flat, which is down from our 1 tick gain of last week. Our option positions now look like this:
Long 1 September 123 Call Option @ 0.03 Now trading at 0.01 (-0.02)
Short 1 December 123 Call Option @ 0.19 Now trading at 0.13 (+0.06)
Long 1 September 110 Put Option @ 0.06 Now trading at 0.03 (-0.03)
Short 1 December 110 Put Option @ 0.31 Now trading at 0.33 (-0.01)
There is still 33 days to go until expiration and it looks like volatility is on the increase, so let's see how things pan out this week as earnings announcements continue.
Update - 29th July
There was a bit of action late in the week and Sep T-Bonds took a bit of a tumble Friday afternoon to close at 115^10 (down 17 since last week).
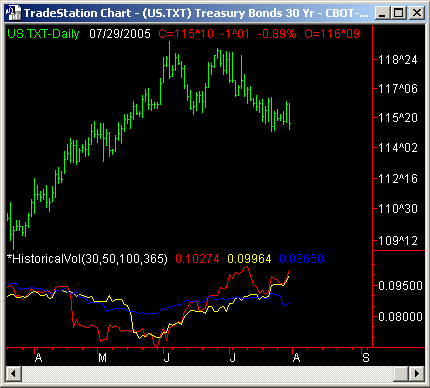
Not much as happened with our position either - we are still flat P&L.
Long 1 September 123 Call Option @ 0.03 Now trading at 0.01 (-0.02)
Short 1 December 123 Call Option @ 0.19 Now trading at 0.09 (+0.10)
Long 1 September 110 Put Option @ 0.06 Now trading at 0.03 (-0.03)
Short 1 December 110 Put Option @ 0.31 Now trading at 0.36 (-0.05)
The front month options haven't moved since last update and the movements in the back month call and put options have simply offset one another to leave us flat.
Volatility is still increasing, however, the movements haven't been enough to really boost our long front month options. If implied volatility increases we should see the prices for these options increase, and hopefully, more than the price shifts in the back month options.
Stay tuned...
Update - 5th August
T-Bonds have suffered further decline on speculation the Fed will be more biased towards raising rates in the future as the economy surges forward and inflation becomes more of a concern.
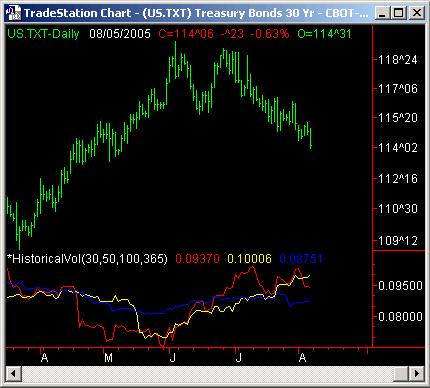
Our combined position is now showing a net loss of 0.07 ticks or -$109.38. Here is a summary of our positions:
Long 1 September 123 Call Option @ 0.03 Now trading at 0.01 (-0.02)
Short 1 December 123 Call Option @ 0.19 Now trading at 0.05 (+0.14)
Long 1 September 110 Put Option @ 0.06 Now trading at 0.02 (-0.04)
Short 1 December 110 Put Option @ 0.31 Now trading at 0.46 (-0.15)
Update 12th August
Our position is still on the decline. We are now down $203.13 per spread or 13 ticks and implied volatility has been declining all week.
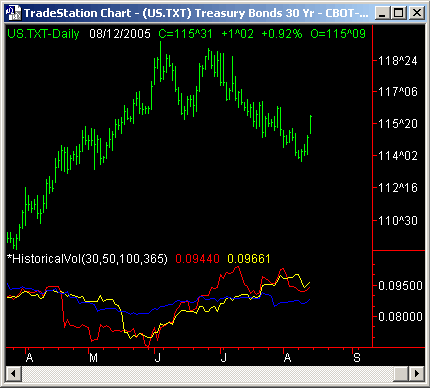
Here is a look at our position as at Friday's close (12th August):
Long 1 September 123 Call Option @ 0.03 Now trading at 0.01 (-0.02)
Short 1 December 123 Call Option @ 0.19 Now trading at 0.09 (+0.10)
Long 1 September 110 Put Option @ 0.06 Now trading at 0.01 (-0.05)
Short 1 December 110 Put Option @ 0.31 Now trading at 0.23 (-0.08)
Current open P&L is a net loss of 0.13 ticks, or -$203.13
I was thinking of closing out both positions as volatility really isn't looking like increasing substantially before these options expire, however, I may as well onto these positions a little while longer and see what happens.
Update 13th September
Well, it has been a long time since my last update. Sorry about that, but I got married on August 27th and I'm just getting back into things. But anyway, here is that latest T-Bond chart as at the close on the 12th Sep.
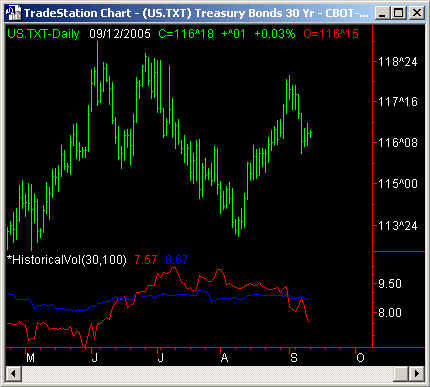
Now, it has been a month since the last update and the September options have now expired. Expiration for the September options was on August the 26th. With the underlying futures trading at 116^11 on the 26th, meant that the 123 Call option and the 110 Put option both expired worthless and we have since lost the premium on those trades.
However, we are still short the 123 December Call option and also short the 110 December Put option. As at the 13th September our position looks like this:
Long 1 September 123 Call Option @ 0.03 Expired worthless (-0.03)
Short 1 December 123 Call Option @ 0.19 Now trading at 0.06 (+0.13)
Long 1 September 110 Put Option @ 0.06 Expired worthless (-0.06)
Short 1 December 110 Put Option @ 0.31 Now trading at 0.08 (+0.23)
So, our total P&L for both spreads is now a profit of $421.875.
I calculated the maximum loss for these two spreads to be $1,669.29, which means we made a return on investment of 25.27%.
To calculate the maximum loss, I used the Option Trading Workbook. I built these two time spreads using the Call and Put option formulas and changed the underlying price. I actually used the Solver function in Excel to find the maximum loss for each spread by changing the underlying price.
You can read more about Dave's trading ideas and method by visiting DeltaNeutralTrading (link removed as site no longer active).
JDMarch 4th, 2011 at 5:55pm
Hi, thanks for the great info in simple form.
I am very...new at this and got totally lost at the future options example. However, if you don't mind putting an example like HD or GOOG or something and explain how the Calendar/Time spread would work, I think people like me would understand better.
Thanks again for the best info i've come across.
JD
PeterJanuary 24th, 2011 at 3:53pm
Hi Mike, thanks for the positive feedback! To answer your questions;
1. Yes, that is correct. The idea from the trade example that I took from the publisher only trades this strategy up until the expiration of the first month. It was only that I was late on the update that the other side was closed out after that point. But yes, you would have a larger margin to pay on the short strangle.
2. Yes, in hindsight that would have been the better play, however, the initial trade setup was that the front month strangle was under priced relative to the back month strangle so I expected these options to increase more in value.
3. Yes, correct as per point 2. I wanted the front month spread to benefit relative to the back month spread from a volatility change.
4. Yes it would but you would expect the front month spread to change by a greater percentage as options closer to their expiration dates are more sensitive to volatility changes.
Let me know if anything is unclear.
MikeJanuary 21st, 2011 at 10:30pm
Hi,
Found your website, quite interesting trade examples. Not sure if you continue updating your website and answer comments, since it is now 2011. Anyways, I was wondering, your net result for the trade was a gain on Sep. 13th, however the long options expired in August. My questions are:
1. Doesn't this mean you only have a short strangle after the expiration in August? Wouldn't the margin increase significantly since you no longer have hedge?
2. In the example above, both short call and short put made profits, while the long call and put lost their entire value. You lose your hedge in the end. Wouldn't it be better off if you simply short the December strangle from the beginning? Is this idea valid? Since there is a price deficiency, hopefully it will correct itself over time because it was overpriced!?
3. You mentioned several times that you wanted the volatility to increase in order to boost the front month options price. Am I correct to say that your plan was to close the position before expiration, if the volatility did spike higher to boost the price of the front month strikes, while the December strikes will suffer from time decay more than benefit from the increase of volatility?
4. If volatility increases, which means price may move faster, wouldn't that actually hurt the short strangle?
Thanks for sharing your knowledge. Very interesting website!
Mike
Add a Comment