2nd March, 2007
Page 1 | Page 2
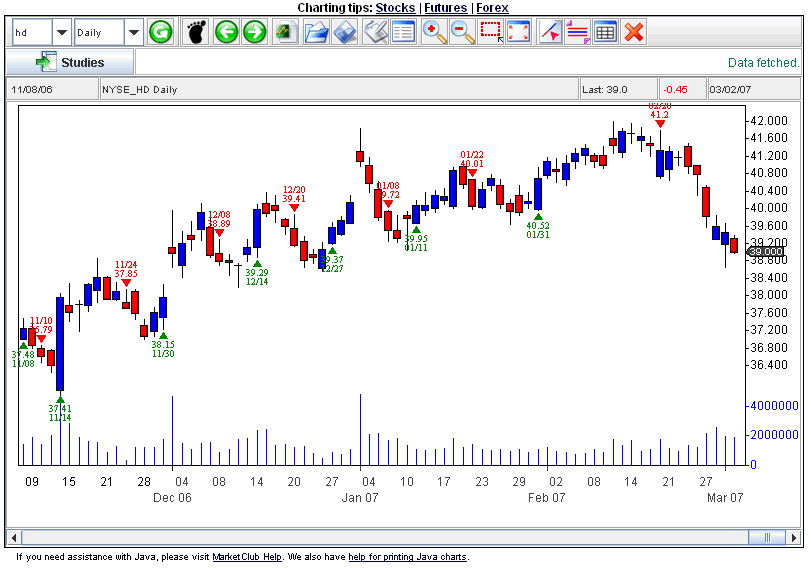
This trade is going terrible. Last week saw the Dow drop 400 points after China went into a downspin. Home Depot ended the week trading at $39 - down $1.96 or 4.79%.
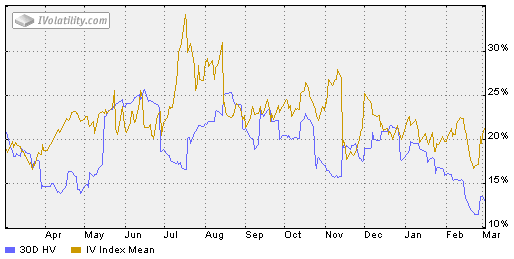
Implied volatility, however, is up over 5% to 23%.
Increasing volatility helps long option positions because option premiums increase. When there is more activity in an underlying asset, the options then have a much greater chance of being in the money by the expiration date.
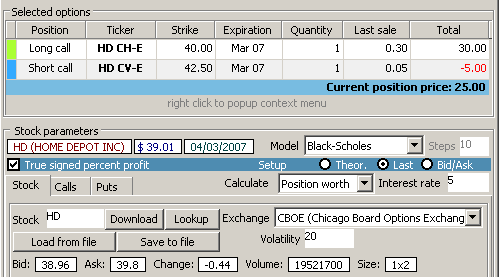
The positive effect of the volatility has not been any where near enough to counter act the downward move of the stock. Despite the increase in volatility, the spread dropped $95 to end the week trading at $25.
When I first started thinking about what trade to place for Home Depot, I was considering a call backspread, which at the time was trading at a $105 credit. If I had of stuck with that trade, I would have been $85 per spread in the black now. Instead, I am now down $95.
For this call spread to now become profitable, the stock must trade up and beyond $41.15, which is a 5.51% move in 21 days. If it does trade $41.15 by expiration, I will still only have broken even. And I know that time decay will start having a greater effect on this position as the expiration date approaches.
So, I will cut my losses and move onto my next trade.


There are zero comments
Add a Comment