The Ultimate Option Scanner to Improve Your Trading
Discover how to find the best option trading opportunities and become a successful options trader today.
- Scans in seconds
- Supports thousands of stocks and ETFs
- Customizable filter criteria
- Volume, open interest and implied volatility
- Custom ticker lists
- 30 day money back guarantee
Triple Your Money in 3 Easy Steps!
Run the Option Scanner
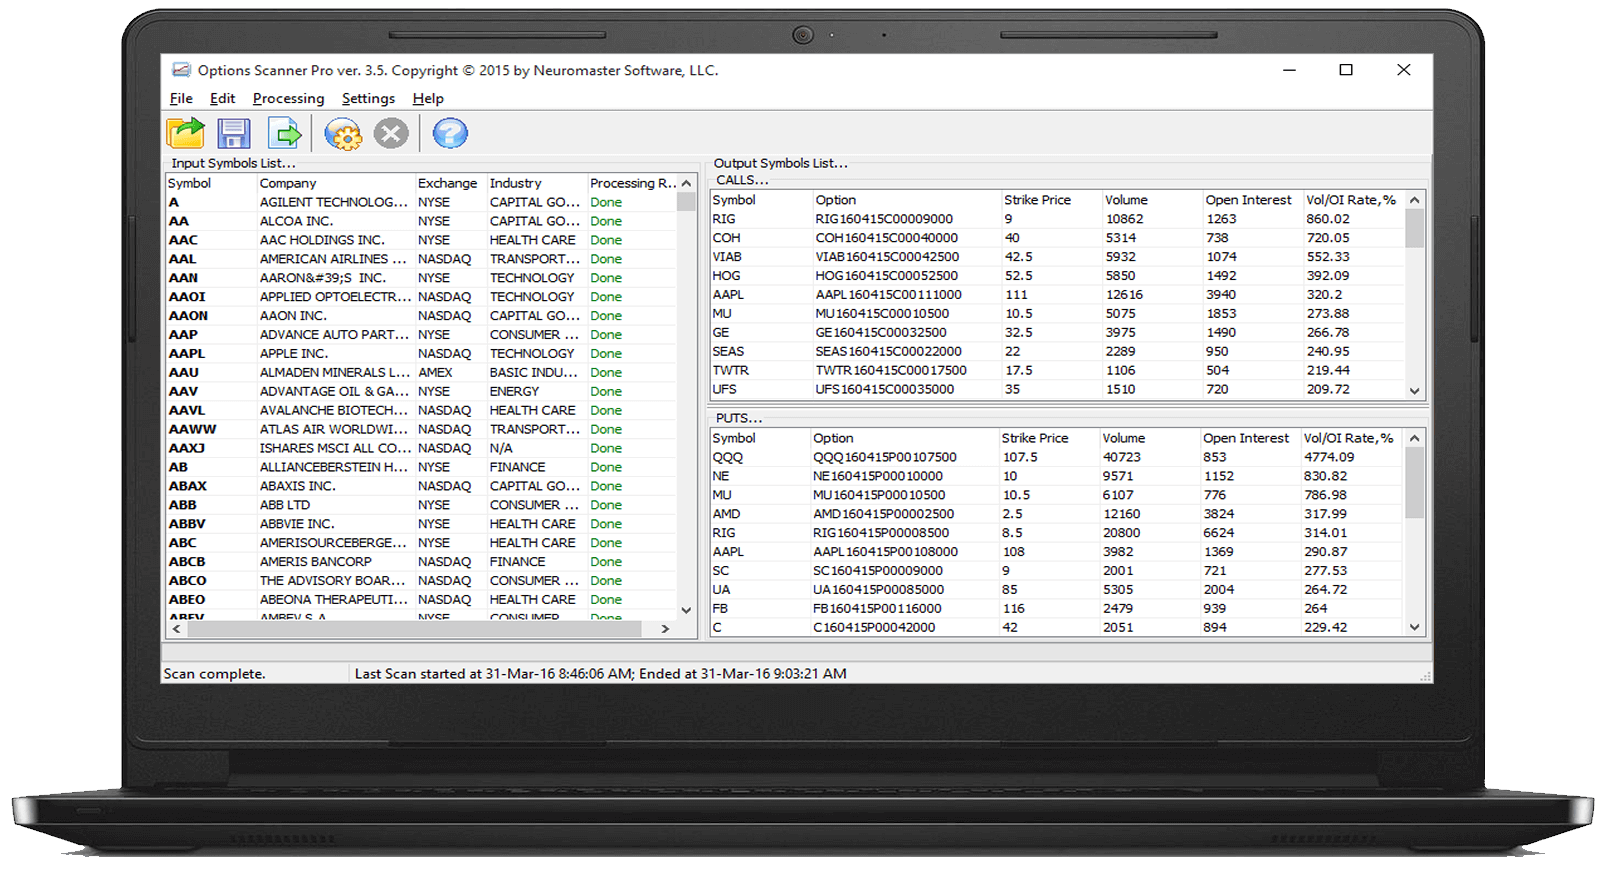
Scan thousands of tickers in seconds. Grab your shortlist of option candidates and look for those that have shown large abnormal volumes vs open interest.
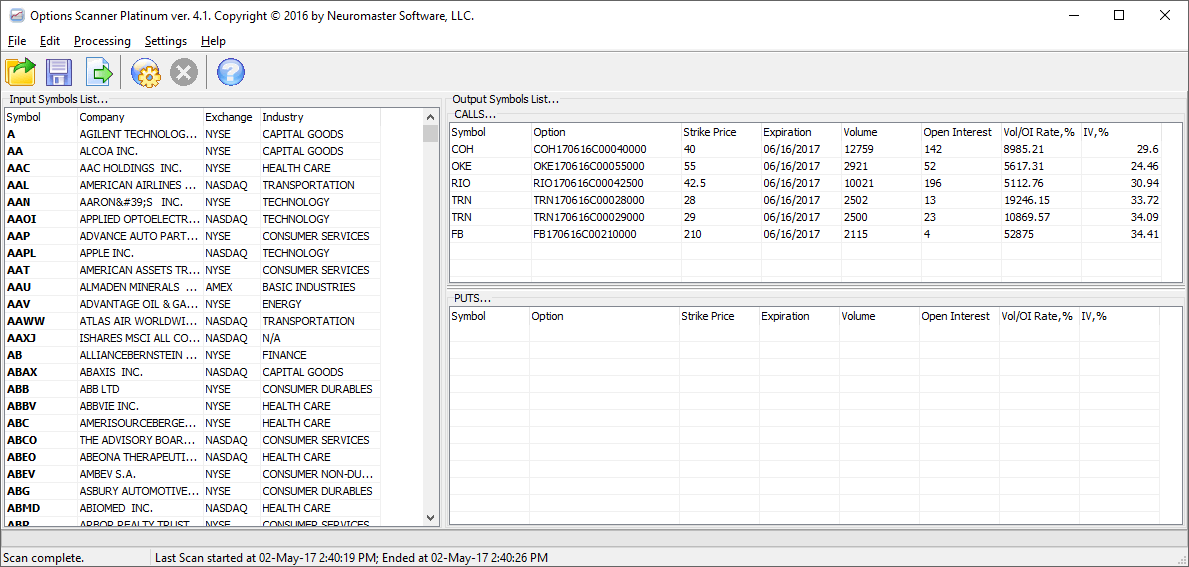
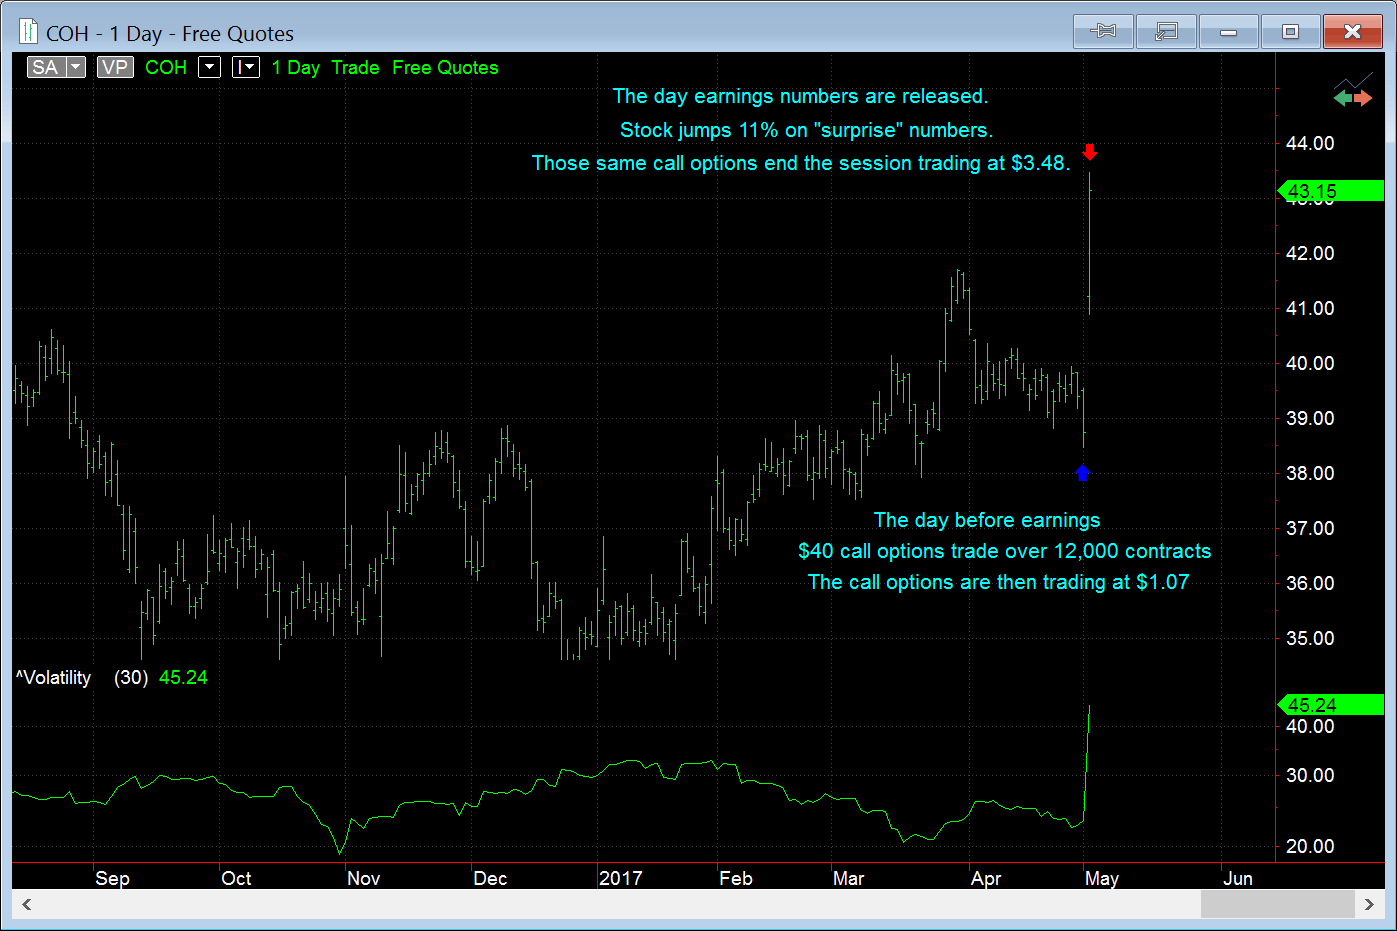
E.g. take a look at Coach Inc (COH) on the screen shot. The $40 call options are at the top of the list for suspicious activity.
Verify & Place Trade
Some stocks naturally trade a lot of options, so high volumes don't always equal a good opportunity. To be sure that something big might happen, make sure you look at the volumes for the day and check that the strike shown is significant.
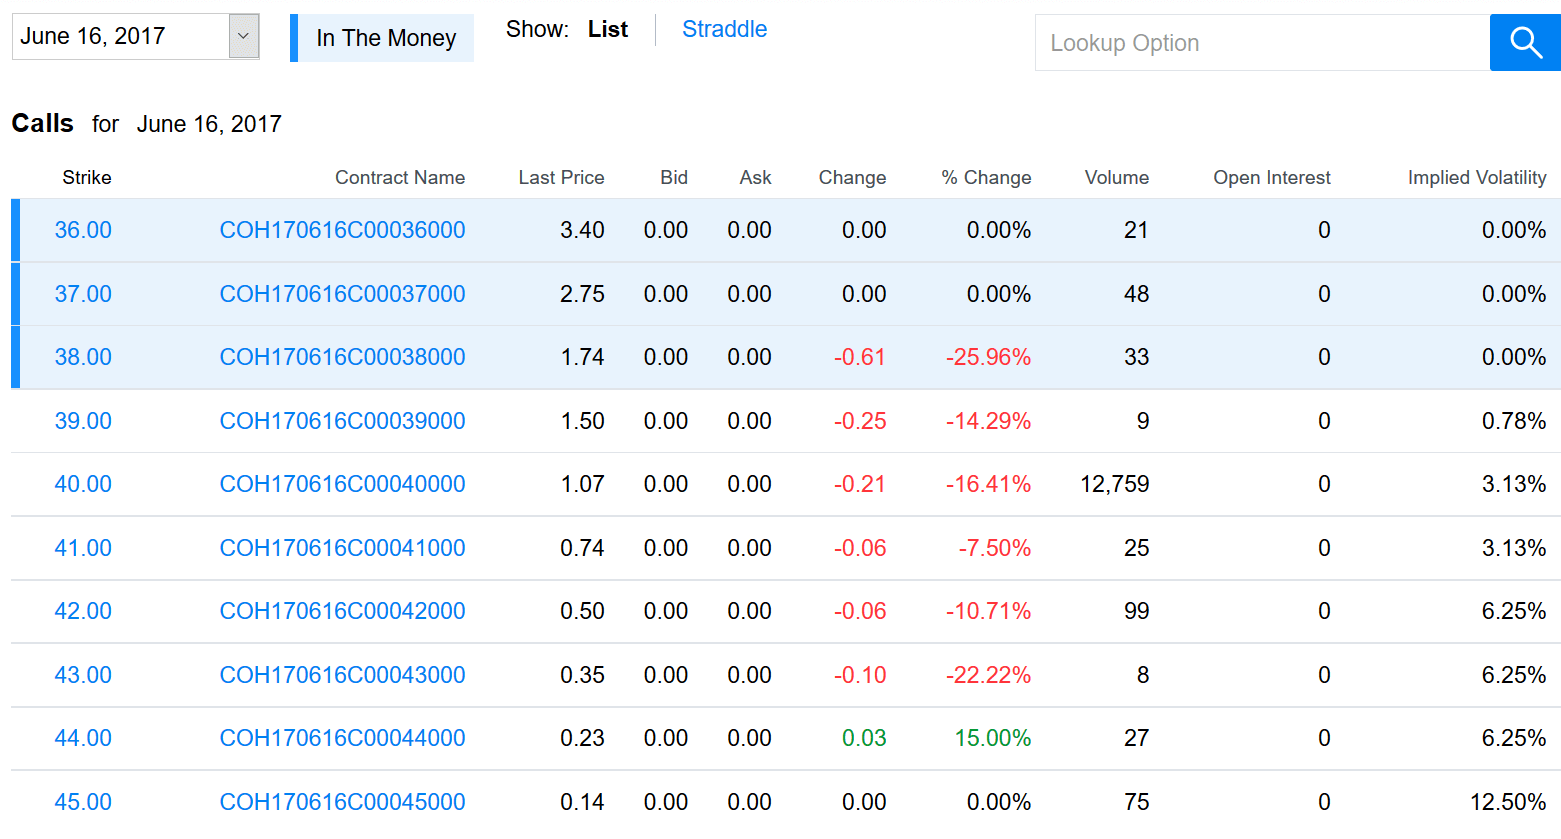
E.g. the $40 call options here traded 12,759 times where the other strikes barely reached 100. Also, COH is about to release their Q1, 2017 numbers the next day.
Wait for the Stock to Pop
The next trading day (2nd May, 2017) COH releases their earnings numbers, which come as a "surprise" to the market. The stock jumps 11% on the news.
The $40 call options went from $1.07 to $3.48 in a single day! The firm that bought those 12,759 contracts made $3,074,919 overnight.
Here's How You Will Spy on the Trading Footprints Left by Wall Street Insiders
Volume Signifies Key Trading Levels
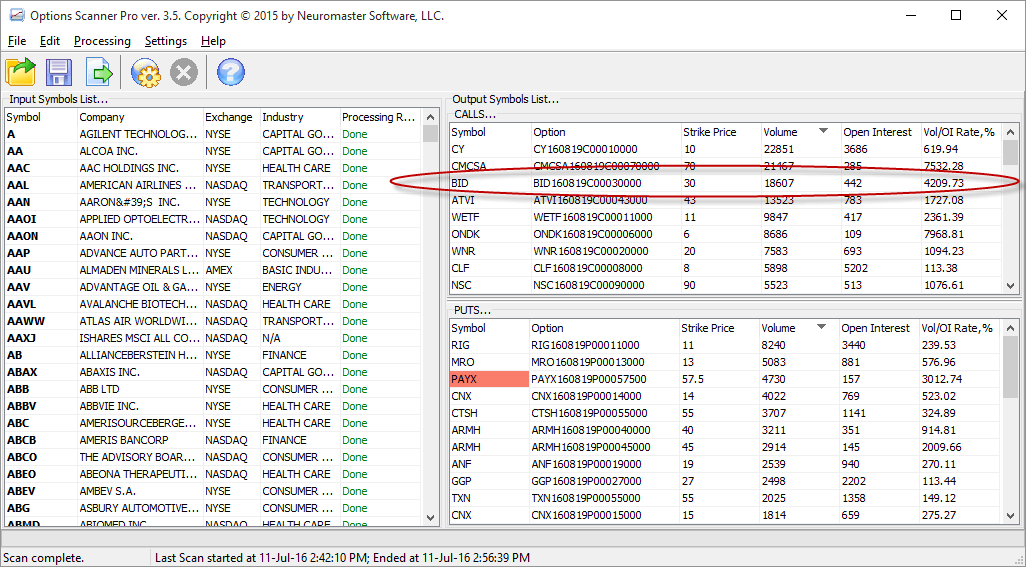
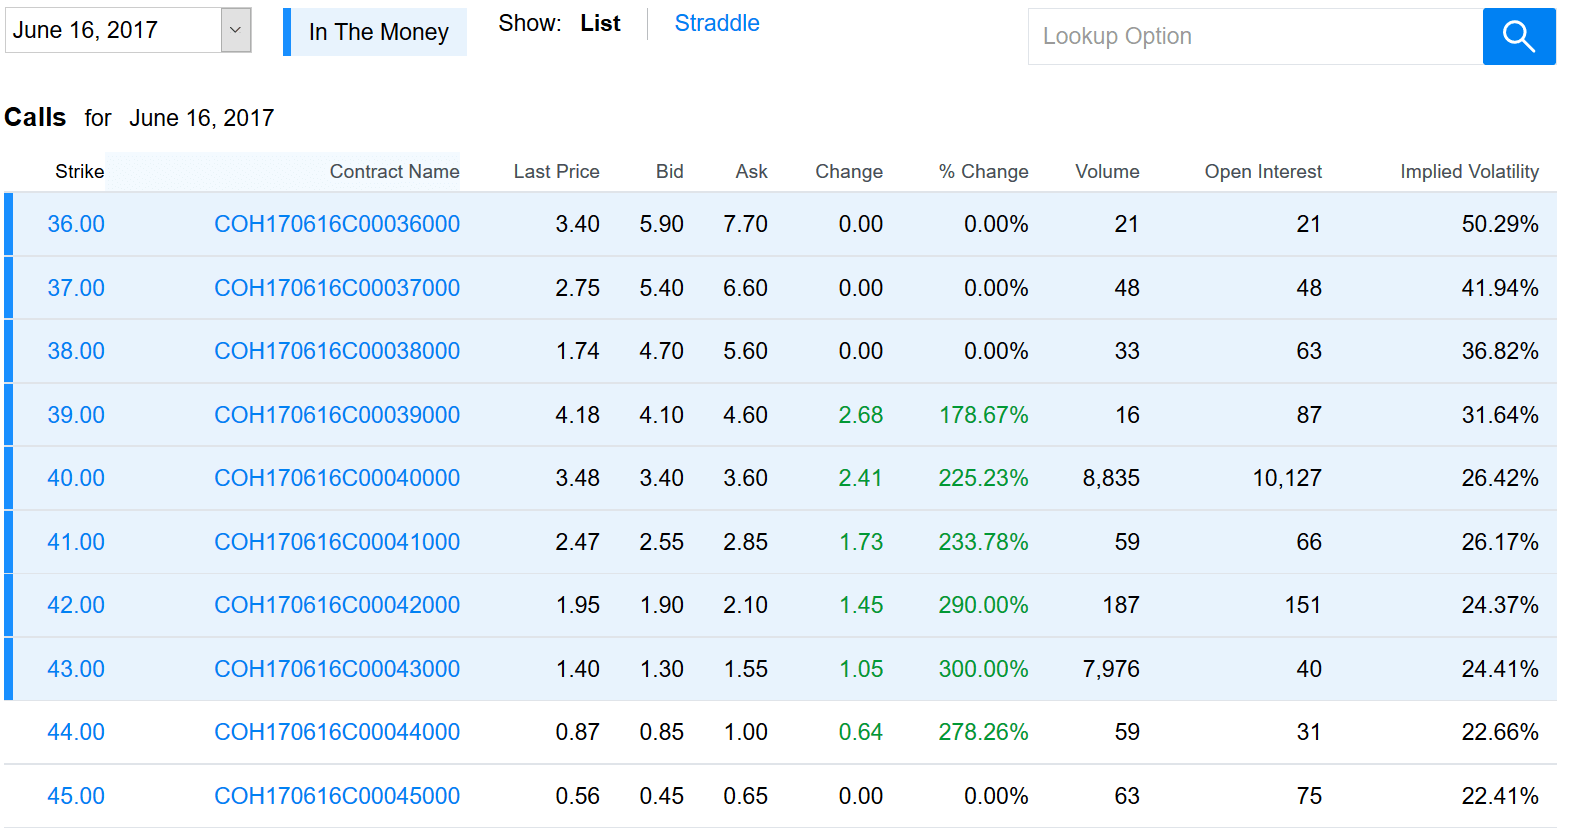
This is the exact screen shot of the Option Scanner before I made a 1,300% return, which you can read more about in the next section.
The scanner produces these results every day, in an instant, and shows you what option contracts have had the most significant volumes trading vs their open interest. If this happens on a stock before an earnings announcement, it means somebody is placing a HUGE bet on the outcome of the earnings release.
Now, why would 18,607 contracts trade through a single option contract before a stock reports its earnings numbers? This trade represents $55,821,000 worth of stock in one strike alone in a single day. These bets aren't made by Mom and Dad investors — they are institutions with huge money at stake and trading from information unavailable to retail traders.
But you can observe the footprints they leave with this powerful trading tool.
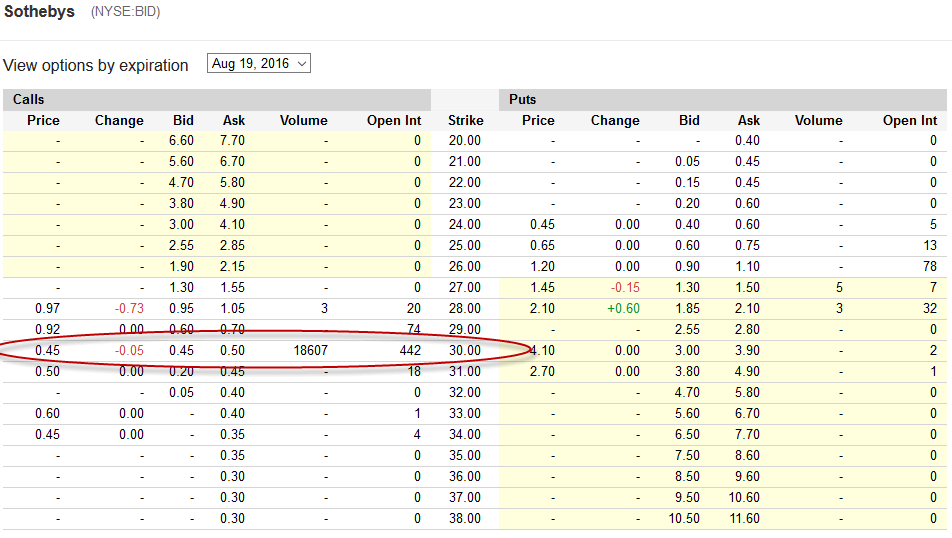
I also took a screen shot of the option chain as I entered the trade. Check out the volumes of the other strikes — almost nothing. Yet this one strike price, $30, trades over 18,000 times two days before the stock releases earnings.
I'm not saying you are guaranteed to make money like this every time — in fact, you won't make money every time. But wouldn't you agree that this is a superb opportunity to take a further look into?
Real Money Trading Examples
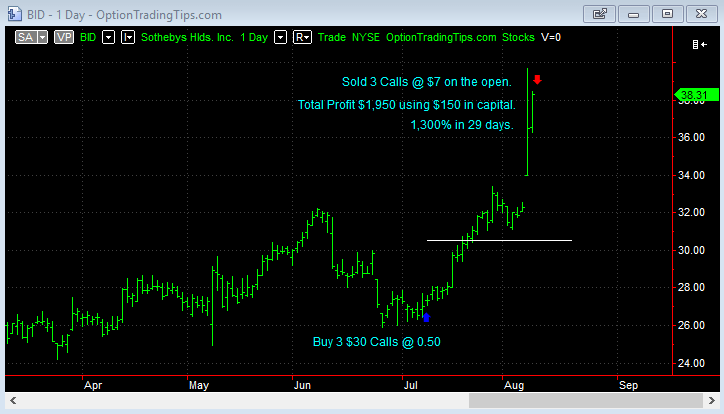
1,300% in 29 Days!
My biggest gain with the Option Scanner. I bought 3 $30 call options @ 0.30 for a total spend of $150 and sold back the calls for $7 less than a month later. Total profit of $1,950 using only $150 in risk capital.
Trade summary →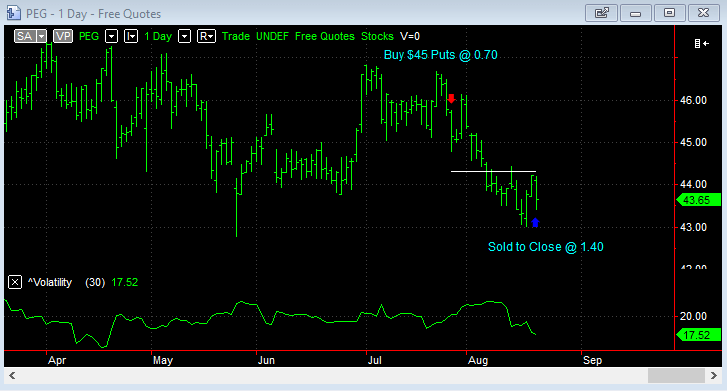
100% Return in 23 Days
The scanner showed 11k contracts trading on the $45 puts — 2 days before earnings. I bought 2 lots of $45 Puts @ 0.70 each. Stock dropped ~3.5% after earnings. Closed out @ 1.40, doubling my money.
Trade summary →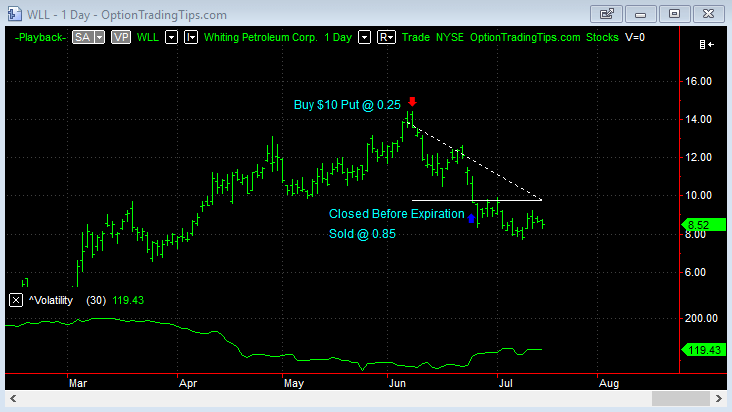
240% Return in 16 Days
I bought $10 puts on WLL @ 0.25. After I shorted the market, the stock tanked 30% in 15 days. The puts were worth 0.85 — I exited early and made 240%. If I'd held to expiry it would have been 592%!
Trade summary →Insane Bonuses Included
Secret Strategy Video
Immediately after you purchase, you will be directed to a bonus video tutorial demonstrating exactly how to use the scanner not only for option gains but as a way to trade stocks outright!
Value: $97
Free Upgrades for 1 Year
The developer is always making improvements — faster scans, more data including implied volatility. Typically these updates require a small upgrade fee, however charges are waived for the first year.
Value: $197
Lifetime Data Feed
The Option Scanner uses end of day option data from all US option exchanges including implied volatility. Subscribing to this data from a vendor would cost $97 per month — included free with your purchase.
Value: priceless!
Interested in the Option Scanner?
The vendor is keeping license sales restricted. If you are interested please get in touch and I'll contact the vendor on your behalf.
- Unusual Volume Options Scanner 5.0 Platinum
- Secret Strategy Video ($97 value)
- 1 year free upgrades ($197 value)
- Lifetime data feed ($97/month value)
30 day money back guarantee
34 Comments
Peter December 13th, 2020 at 7:19pm
Hi Terry,
No, this only works for options; not technical analysis.
Terry December 13th, 2020 at 6:01pm
Does the platform have a built in Ichimoku cloud strategy?
Peter September 15th, 2020 at 5:50pm
It's end of day data.
Jason Vrimi September 15th, 2020 at 5:40pm
Hello,
Just wondering that if this scanner is work in real time or update by EOD?
Thank you
Peter March 17th, 2019 at 11:02pm
Hi Arshtit, it won't work for the Indian market at this time...only for US markets. I will ask the developer if there are plans to add Indian data.
The Open Interest field is total, not change.
ARSHTIT March 17th, 2019 at 4:41am
Is open interest is mentioned, it's total OI or change in OI?
ARSHIIT March 17th, 2019 at 12:15am
How do I can use it for indian stock market?
Peter February 18th, 2019 at 4:56am
@PRP - It is a Windows based application.
@Neal - it doesn't time series data, so no timestamp. Sorry, no closed captions on the video!
The fee has remained as is for about two years and is subject to the developer's own pricing.
The data used currently is EOD, however, this may also change. Previously it was 15 minute delayed but didn't have the coverage of assets and expiry dates. While the EOD data is less frequent there are more instruments covered.
PRP February 14th, 2019 at 10:02am
Is this a web based tool or something that requires an application to be downloaded on a PC?
Neal February 14th, 2019 at 2:06am
Hello,
Does your option scanner pro give us the option to see the timestamp or the time and date when the market makers bought the stock? Also, does your video have the closed caption or subtitle for tutorial? I saw that the fee is being upgraded for free for the first year, what is the cost of upgrade in the second year? How much of delay is the data feed? Thank you for your time.
-Neal
Add a Comment