Option Delta
Definition: The Delta of an option is a calculated value that estimates the rate of change in the price of the option given a 1 point move in the underlying asset.
7 Days of Option Lessons Delivered to your Inbox Show Me More »
As the price of the underlying stock fluctuates, the prices of the options will also change but not by the same magnitude or even necessarily in the same direction. There are many factors that will affect the price that an option will change by e.g. Whether it is a call or put, the proximity of the strike to the underlying price, volatility, interest rates and time to expiry. This is why the delta is important; it takes much of the guess work out of the expected price movement of the option.
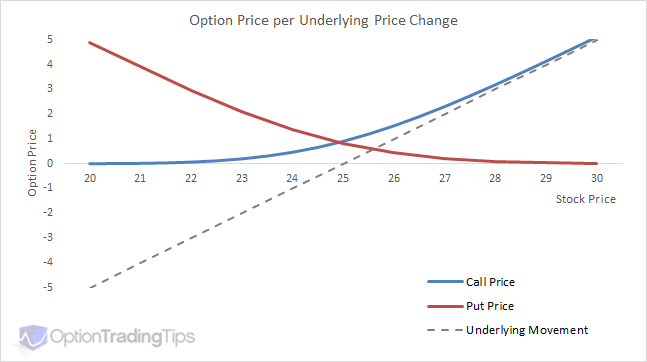
Take a look at the above graph. The chart compares the movement of an underlying versus the option prices at each underlying level for both a call and put option with a $25 strike price. The dotted line represents the price "change" for the underlying with the actual price of the stock on the horizontal axis. The corresponding call and put options for the x-axis stock prices are plotted above; call in blue and put in red.
The first thing to notice is that option prices do not change in a linear movement versus the underlying; the magnitude of the option price change depends on the options' "moneyness". When the stock is at $25 both options are at-the-money and will change in price by the same amount as the underlying moves, which is +/- 0.50. ATM options are therefore said to be "50 Delta".
Now, at either end of the graph each option will either be in or out of the money. On the right you will notice that as the stock price rises the call options increase in value. As this happens the price changes of the call option begin to change in-line with changes in the underlying stock. On the left you will notice the reverse happens for the put options: as the stock declines in value, the put options become more valuable and the increase in the value of the put begins to move 1 for 1 with the underlying (that is a negative move in the stock results in a positive move in the value of the put option).
Note: Delta is only an estimate, although proven to be accurate, and is one of the outputs provided by a theoretical pricing model such as the Black Scholes Model. 1 point means a full dollar movement i.e. From 25.56 to 26.56 is a 1 point increase.
Delta is one of the values that make up the Option Greeks; a group of pricing model outputs that assist in estimating the various behavioral aspects of option price movements.
Symbology and Usage
Deltas for call options range from 0 to 1 and puts options range from -1 to 0. Although they are represented as percentages traders will almost always refer to their values as whole numbers. E.g. If an option has a delta of 0.65 it will be declared by the trader as "sixty five".
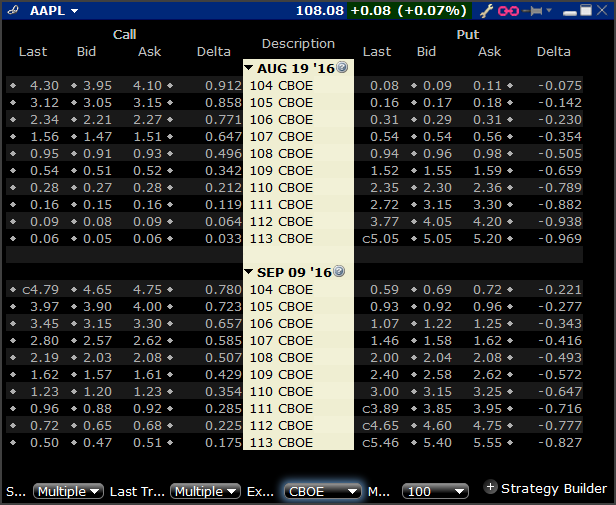
Here is an example of what deltas look like for set of option contracts. The above shows the calls (left) and puts (right) for AAPL options. Notice that the calls are positive and puts are negative.
Now, take the $108 strike for the Aug 19 call options. The market price for this is 0.92 (middle of bid and ask) and it is showing a delta of 0.496. What this number means is if APPLE shares move by 1 point i.E from $108.08 to $109.08 then the price of the call option can be expected to increase in value from 0.92 to 1.42.
The same concept applies to the puts; looking at the $110 strike for the Sep 09 puts. The delta showing for the put option is -0.647. If the stock moves from $108.08 to $109.08 then the option value will decrease from $3.20 to $2.55. The option price decreases in value because the delta of the put option is negative.
Note: the reverse happens for a negative market move; if AAPL shares drop from $108.08 to $107.08 then the Aug 19 $108 call will drop from 0.92 to 0.42 and the Sep 09 $110 put will "increase" from $3.20 to $3.85.
Selling Reverses the Delta
When you see deltas on screen, like the above option chain, they represent the value movement of the option if you were to be the holder of the option i.e. the buyer. So, if you bought a put option, your delta would be negative and the value of the option will decrease if the stock price increases.
However, when you sell an option the opposite happens. For example, if you are short a call option at $1.25 and the price of the option rises to $1.50 then your position is now worse off by -$0.25. In this case you were short delta because a positive move in the underlying had a negative effect on your position.
Here is a summary of option position vs delta sign:
- Long Call
- Positive Delta
- Short Call
- Negative Delta
- Long Put
- Negative Delta
- Short Put
- Positive Delta
3 Additional Uses for Delta
Although the definition of delta is to determine the theoretical price change of an option, the number itself has many other applications when talking of options.
Directional Bias
The sign of the delta tells you what your bias is in terms of the movement of the underlying; if your delta is positive then you are bullish towards the movement of the underlying asset as a positive move in the underlying instrument will increase the value of your option. Conversely a negative delta means you're position in the underlying is effectively "short"; you should benefit from a downward price move in the underlying.
Example: let's say you sell an ATM put option that has a delta of -0.50. The delta of the option is negative, however, because you have sold the option, you reverse the sign of the delta therefore making your position delta positive (a negative multiplied by a negative equals a positive).
If the stock price increases by 1 point, a negative delta means the price of the option will decrease by 0.50. Because you have sold the option, which has now decreased in value your short option position has benefited from an upward move in the underlying asset.
Due to the association of position delta with movement in the underlying, it is common lingo amongst traders to simply refer to their directional bias in terms of deltas. Example, instead of saying you have bought put options, you would instead say you are short the stock. Because a downward movement in the stock will benefit your purchased put options.
Hedge Ratio
Option contracts are a derivative. This means that their value is based on, an underlying instrument, which can be a stock, index or futures contract. Call and put options therefore become a sort of proxy for long or short position in the underlying. I.e. Buying a call benefits when the stock price goes up and buying a put benefits when the stock price goes down.
However, we know now that the price movement of the options doesn't often align point for point with the stock; the difference in the future movement being the delta. The delta therefore tells the trader what the equivalent position in the underlying should be. For example, if you are long call options showing a delta of 0.50 then your position in the option is effectively half that of the underlying instrument's value.
To make the comparison complete, however, you need to consider the option contract's "multiplier" or contract size. To read more on using the delta for hedging please read:
This page explains in more detail the process of delta neutral hedging your portfolio and is the most common of the option strategies used by the institutional market.
Probability Indicator
Many traders also the delta to approximate the likely hood that the option will expire in-the-money.
When the option is ATM, or more precisely, has a delta of 0.50 (-0.50 for puts) then there is an equal chance that the option will be in the money at the expiration date i.e. That the stock will be trading higher than the strike price for the call option or lower than the strike price for the put option.
Changes in the delta as the stock price move away from the strike change the probability of the stock reaching those levels. A call option showing a delta of 0.10 can be said to have a 10% chance of the stock expiring above the call's strike price by the expiration date.
Delta isn't Constant
You can see that the delta will vary depending on the strike price. But the delta "at" the strike can also change with other factors.
Moneyness
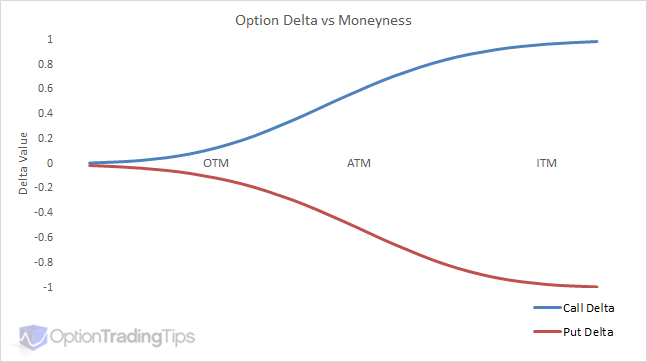
This is a graph illustrating the the change in the delta of both call and put options as each option moves from being out-of-the-money to at-the-money and finally in-the-money.
Notice that the change in value of the delta isn't linear, except when the option is deep in-the-money. When the option is deep ITM the delta will be 1 and at that point will move in-line with the underlying instrument.
Time to Maturity
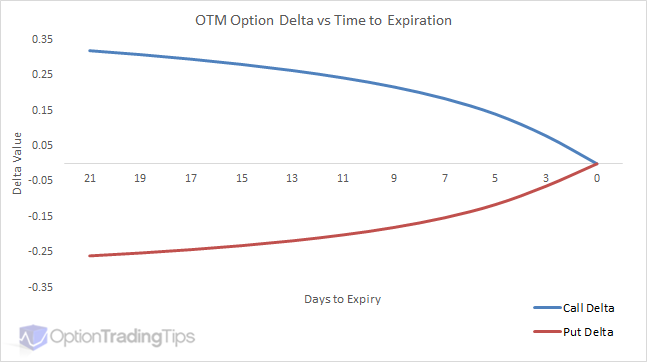
This chart graphs an out-of-the-money call and put. The call option is a $26 strike price and the put option is a $24 strike price. The underlying in this example is a constant $25. The horizontal axis shows the days until expiration. Both call and puts are approximately +/- 25 deltas with 21 days to expiration. As the time erodes there is less and less chance of both expiring in-the-money so the corresponding delta for each option approaches zero as the expiration date closes in.
Volatility
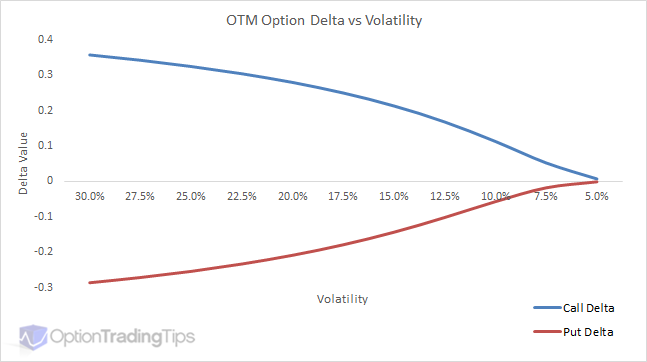
Similar to the Time to Maturity graph, this above chart plots out-of-the-money options vs changes in volatility.
Notice that the changes in shape of the delta curve as volatility approaches zero is similar to the shape of the curve as time to expiration approaches zero?
Delta in Brief
Here are some key points as discussed above:
- Delta is one of many outputs from an option pricing model jointly referred to as Option Greeks. Other greeks being gamma, theta, vega and rho
- The value of the delta approximates the price change of the option give a 1 point move in the underlying asset
- Delta is positive for call options and negative for put options
- The sign of delta is your directional indicator i.e. A positive delta means you're long the underlying asset
- Delta serves as an approximation for the probability of the option expiring in-the-money
- When you multiply the delta by the contract size (typically 100 for equity options) of the option you have an equivalent position of that many shares in the underlying
- Delta isn't constant; the value changes due to other factors i.e. Stock price, time to expiration, volatility, interest rates.
I think the best way to understand the behavior of option prices, the greeks etc is to simulate them using an option model. You can download my option spreadsheet from this site or use an online version such as this option calculator.
Feel free to let me know if you have any questions by leaving a comment below.
Learn options trading in 7 days
Each day one focused lesson lands in your inbox — from first principles to your first trade.
86 Comments
Peter October 10th, 2014 at 4:25pm
Hi SaulusPaulus,
The theoretical price for a call and put will be the same where the strike = ATM Forward price. Where the ATM Forward is the spot price + cost of carry - expected dividends. However, this is not the same as (Call Price * Delta) = (Put Price * Delta). I don't think there is a relationship between (Call Price * Delta) and (Put Price * Delta) that is easily observable.
Typically the ATM Forward price is slightly higher than the current spot price. But even at this price the deltas of the options won't be the same; the call delta will be approximately 52 and the put -48.
You're welcome to use my option pricing spreadsheet - it's a good way to familiarise yourself with the theoretical values by playing around with various scenarios and viewing the changes that take place after changing the inputs to the model.
SaulusPaulus October 10th, 2014 at 11:04am
Hello Peter,
Thanks for your very informative website.
I have a few theoretical questions regarding the delta for European Calls/Puts in the Black Scholes Framework.
1. For what spot price is |delta*Call| = |delta*Put| ?
2. When |delta*Call| = |delta*Put|, what is the delta? Which Option is worth more?
Delta should be 0 and Call option should be worth more as its value is not capped through the stock price?
Thanks in advance!
Peter March 27th, 2014 at 5:37am
Hi Anu,
Not sure what you mean by CE/PE - but you can either use my option spreadsheet or an online option calculator to simulate various option greek and pricing values.
anu March 27th, 2014 at 1:58am
hi..
i started he option trading now a days.so please give me guidance.i know the basics.but is there any calculations for Eg:what give the market today(CE/PE) and how much points. or what will be the tomorrows status..Please help..
Thank you.
Veggies June 2nd, 2013 at 1:18pm
I'm not sure how to solve this question. Can anybody help me please. ugently!
A delta-neutral position is a portfolio that is immune to changes in the stock price, the portfolio of options and stock has a position delta of 0.0.
∆p=n1∆1 + n2∆2 + ...=0
Example
Suppose you are 100 puts long with a delta of -0.3.
How many calls, delta of which is -0.83, should you buy or sell to create a delta-neutral position?
∆p=n1∆1 + n2∆2 =0
(100)(-0.3) + n2(-0.85) =0
n2 = -35.29
Negative sign means the call should be sold.
Peter April 16th, 2013 at 6:31pm
Hi Johnny,
I see now - it's the definition of gamma that has caused confusion. "Gamma" measures the change in delta for a "1 point" move in the underlying i.e. from 25 to 26.
Your example has used "Gamma 1%", which will measure the change in delta from a 1% move i.e. 25.25. Hence the need to divide by 100.
johnny April 16th, 2013 at 2:12am
Hi Peter, let's stimulate the below scenario with the free spreadsheet in your site.
Underlying price = 20
Exercise price = 18
Today's date = 16 Apr 2013
Expiry date = 30 Jun 2014
Historical volatility = 22%
Risk free rate = 5%
Dividend yield = 0%
We come up with below:
Theoretical price (call) = 3.7011
Delta = 0.79
Gamma = 0.0597
Let multiplier = 500 and quantity = 25
Total market value = 3.7011 * 500 * 25 = 46264
Cash delta = 0.79 * 20 * 500 * 25 = 197505
Cash gamma = 0.0597 * 20 * 20 * 500 * 25 / 100 = 2983
So assume underlying price moves up by 1% (0.2) to 20.2
New theoretical price (call) = 3.8603
Total market value = 3.8603 * 500 * 25 = 48254
Total PL impact = 48254 - 46264 = +1990
Delta PL impact = 197505 * 1% = +1975
Gamma PL impact = 2983 * 1% / 2 = +15
Delta and gamma PL impact = 1975 + 15 = +1990 which reconciles to total PL impact above
So cash gamma has to be divided by 100 to arrive the sensitivity PL impact - but why...?
Can you please advise and explain? Thanks!
Peter April 16th, 2013 at 12:01am
Hi Johnny,
Yep, you're right about the multiplier - I missed that. I'll change the formula in my comment. However, I'm not sure why they have divided by 100.
If you simulate your position by moving the base price by 1 point does your cash delta of position change by the cash gamma amount?
johnny April 15th, 2013 at 9:46pm
Thanks Peter for the cash greeks formula. I refer to the cash gamma forumla, from my company's risk system, the formula would be:
Cash Gamma of position = gamma of contract * position * underlying price * underlying price * multiplier / 100 (in which * multiplier / 100 are not found in your formula)
Could you please advise and explain?
Peter March 25th, 2013 at 9:30pm
Hi Johnny,
To calculate cash greeks;
Cash Delta of position = delta of contact * multiplier * position * underlying price
Cash Gamma of position = gamma of contract * multiplier * position * underlying price * underlying price
Cash Vega of position = vega of contract * position * multiplier
Cash Theta of position = theta of contract * position * multiplier
Note: Vega and Theta are already expressed in dollars hence no need to multiply by the underlying price.
Add a Comment