Excel Option Pricer
Excel based Black and Scholes calculator for European stock/index options and American options using dividend yields.
- Theoretical Price and Option Greeks support
- Implied Volatility Calculator
- Configurable Payoff Graphs
- Option Strategy Construction
- VBA used is unlocked and editable
Grab Your Free Copy
Enter your name and email and I'll send the workbook straight to your inbox.
My option pricing spreadsheet will allow you to price European call and put options using the Black and Scholes model.
Understanding the behavior of option prices in relation to other variables such as underlying price, volatility, time to expiration etc is best done by simulation. When I was first learning about options I began building a spreadsheet to help me understand the payoff profiles of calls and puts and also what the profiles look like of different combinations. I've uploaded my workbook here and you're welcome to it.
Simplified
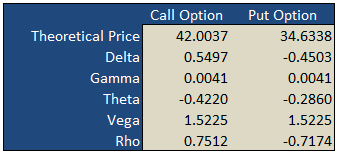
On the "basic" worksheet tab you will find a simple option calculator that generates fair values and option Greeks for a single call and put according to the underlying inputs you select. The white areas are for your user input while the shaded green areas are the model outputs.
Implied Volatility
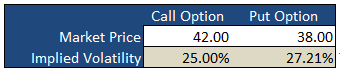
Underneath the main pricing outputs is a section for calculating the implied volatility for the same call and put option. Here, you enter the market prices for the options, either last paid or bid/ask into the white Market Price cell and the spreadsheet will calculate the volatility that the model would have used to generate a theoretical price that is in-line with the market price i.e. the "implied" volatility.
Payoff Graphs
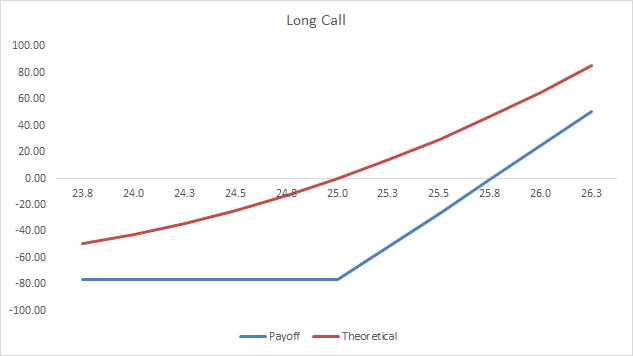
The PayoffGraphs tab gives you the profit and loss profile of basic option legs; buy call, sell call, buy put and sell put. You can change the underlying inputs to see how your changes effect the profit profile of each option.
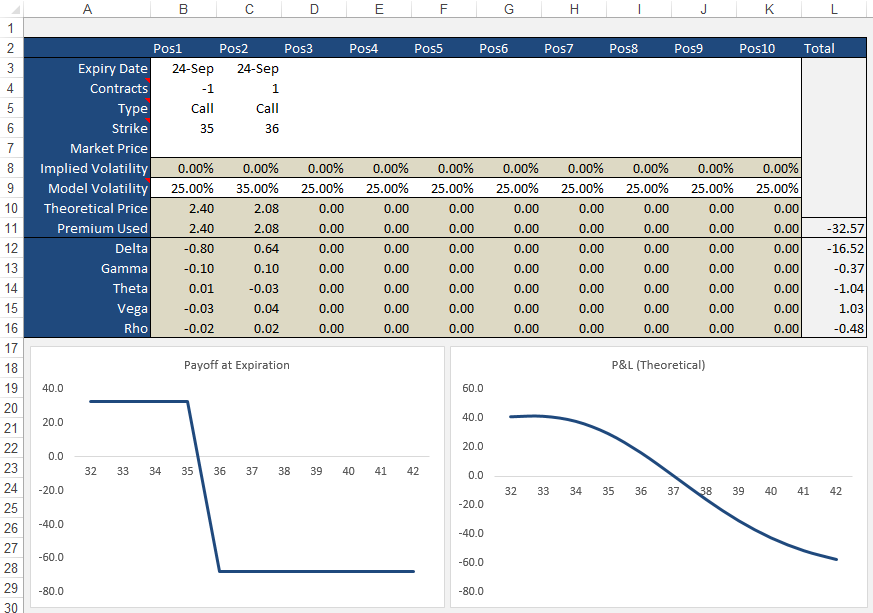
Strategies
The Strategies tab allows you to create option/stock combinations of up to 10 components. Again, use the white areas for your user input while the shaded areas are for the model outputs.
Formulas
Theoretical and Greek Prices
Use this Excel formula for generating theoretical prices for either call or put as well as the option Greeks:
- Type
- c = Call, p = Put, s = Stock
- Output
- p = theoretical price, d = delta, g = gamma, t = theta, v = vega, r = rho
- Underlying Price
- The current market price of the stock
- Exercise Price
- The exercise/strike price of the option
- Time
- Time to expiration in years e.g. 0.50 = 6 months
- Interest Rates
- As a percentage e.g. 5% = 0.05
- Volatility
- As a percentage e.g. 25% = 0.25
- Dividend Yield
- As a percentage e.g. 4% = 0.04
A sample formula would look like =OTW_BlackScholes(c, p, 25, 26, 0.25, 0.05, 0.21, 0.015).
Implied Volatility
Same inputs as above except:
- Market Price
- The current market last, bid/ask of the option
Example: =OTW_IV(p, 100, 100, 0.74, 0.05, 8.2, 0.01)
Support
If you're having troubles getting the formulas to work, please check out the support page or send me an email.
If you're after an online version of an option calculator then you should visit Option-Price.com
Much of what I learnt that made this spreadsheet possible was taken from the highly acclaimed book on financial modeling by Simon Benninga — Financial Modeling - 3rd Edition. If you're an Excel junkie, you'll love it.
118 Comments
max May 24th, 2013 at 8:51am
Hello, what a great file!
I am trying to see how the volatility skew affects the greeks, is it possible to do this on the OptionsStrategies page?
Thank you
Max
Peter April 30th, 2013 at 9:38pm
Hi Wong,
Yes, your numbers sound right. What worksheet are you looking at and what values are you using? Perhaps you could email me your version and I can take a look? Maybe you're looking at the P&L that includes time value - not the payoff at expiration?
wong April 28th, 2013 at 9:05pm
hi, thanks for the worksheet. However, I am troubled by the calculated P/L on expiration. It should be made of two straight lines,joined at the strike price, right? but I did not get that. For example, for a put with strike $9, premium used is $0.91, the P/L for underlying price of 7, 8, 9, 10 were 1.19, 0.19, -0.81, -0.91, when they should be 1.09, 0.09, -0.91, -0,91, isn't that correct?
Peter April 15th, 2013 at 7:06pm
Mmm...the average volatility is mentioned in cell B7 but not graphed. I didn't want to graph it as it would just be a flat line across the graph.
You're welcome to add it though - just email me and I'll send you the unprotected version.
Ryan April 12th, 2013 at 9:11am
Sorry, I reread my question and it was confusing.. I'm just wondering if there is a way to also throw in Avg Volatility into the graph?
Peter April 12th, 2013 at 12:35am
Hi Ryan,
Not sure if I understand correctly. The current volatility is what is graphed - the volatility calculated each day for the time period specified.
Ryan April 10th, 2013 at 6:52pm
Hi,
Great volatility spreadsheet.. I'm wondering if its at all possible to track what the 'current' volatility is. Meaning just like your Max and Min are plotted on the chart, is it possible to add current, so we can see how its changed? If its not at all possible, do you know a program or willing to code this?
Thanks, Ryan
Peter March 21st, 2013 at 6:35am
Hi Desmond,
The VBA is unlocked - just open the VBA editor and all of the formulas are there.
Desmond March 21st, 2013 at 3:16am
can i know the formular in deriving the Theoretical Price in the basic tab
Peter December 27th, 2012 at 5:19am
Hi Steve,
No, not yet, however, I found this site, which seems to have one;
Binary Options Excel
Let me know if it's what you're after.
Add a Comment