Excel Option Pricer
Excel based Black and Scholes calculator for European stock/index options and American options using dividend yields.
- Theoretical Price and Option Greeks support
- Implied Volatility Calculator
- Configurable Payoff Graphs
- Option Strategy Construction
- VBA used is unlocked and editable
Grab Your Free Copy
Enter your name and email and I'll send the workbook straight to your inbox.
My option pricing spreadsheet will allow you to price European call and put options using the Black and Scholes model.
Understanding the behavior of option prices in relation to other variables such as underlying price, volatility, time to expiration etc is best done by simulation. When I was first learning about options I began building a spreadsheet to help me understand the payoff profiles of calls and puts and also what the profiles look like of different combinations. I've uploaded my workbook here and you're welcome to it.
Simplified
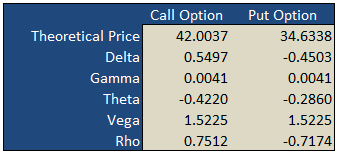
On the "basic" worksheet tab you will find a simple option calculator that generates fair values and option Greeks for a single call and put according to the underlying inputs you select. The white areas are for your user input while the shaded green areas are the model outputs.
Implied Volatility
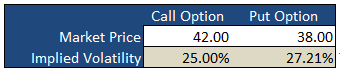
Underneath the main pricing outputs is a section for calculating the implied volatility for the same call and put option. Here, you enter the market prices for the options, either last paid or bid/ask into the white Market Price cell and the spreadsheet will calculate the volatility that the model would have used to generate a theoretical price that is in-line with the market price i.e. the "implied" volatility.
Payoff Graphs
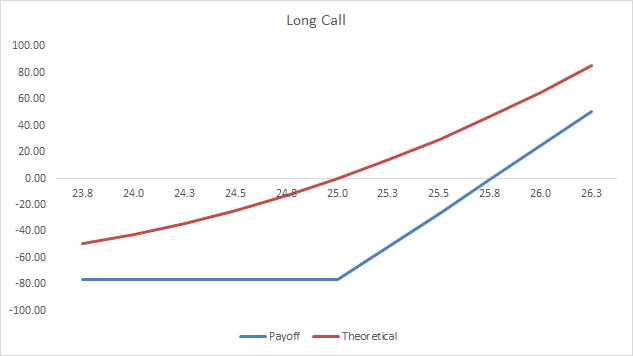
The PayoffGraphs tab gives you the profit and loss profile of basic option legs; buy call, sell call, buy put and sell put. You can change the underlying inputs to see how your changes effect the profit profile of each option.
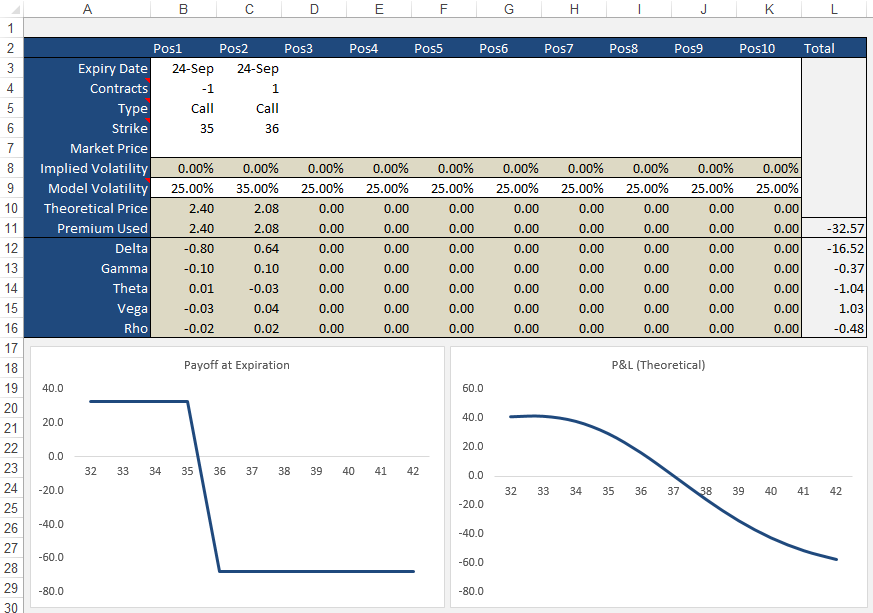
Strategies
The Strategies tab allows you to create option/stock combinations of up to 10 components. Again, use the white areas for your user input while the shaded areas are for the model outputs.
Formulas
Theoretical and Greek Prices
Use this Excel formula for generating theoretical prices for either call or put as well as the option Greeks:
- Type
- c = Call, p = Put, s = Stock
- Output
- p = theoretical price, d = delta, g = gamma, t = theta, v = vega, r = rho
- Underlying Price
- The current market price of the stock
- Exercise Price
- The exercise/strike price of the option
- Time
- Time to expiration in years e.g. 0.50 = 6 months
- Interest Rates
- As a percentage e.g. 5% = 0.05
- Volatility
- As a percentage e.g. 25% = 0.25
- Dividend Yield
- As a percentage e.g. 4% = 0.04
A sample formula would look like =OTW_BlackScholes(c, p, 25, 26, 0.25, 0.05, 0.21, 0.015).
Implied Volatility
Same inputs as above except:
- Market Price
- The current market last, bid/ask of the option
Example: =OTW_IV(p, 100, 100, 0.74, 0.05, 8.2, 0.01)
Support
If you're having troubles getting the formulas to work, please check out the support page or send me an email.
If you're after an online version of an option calculator then you should visit Option-Price.com
Much of what I learnt that made this spreadsheet possible was taken from the highly acclaimed book on financial modeling by Simon Benninga — Financial Modeling - 3rd Edition. If you're an Excel junkie, you'll love it.
118 Comments
sanjeev December 29th, 2011 at 10:22pm
thanks for the workbook.
could you please explain me risk reversal with one or two examples?
P December 2nd, 2011 at 10:04pm
Good day. Indian man trading today Found spreadsheet but does work? Look at it and needs fix to fix problem?
akshay November 29th, 2011 at 11:35am
hello sir,
i am new to options and want to know how options pricing can help us...??
Deepak November 17th, 2011 at 10:13am
Dear Sir ,
thanks for the reply .. but i am not able to collect the Historical Volatility , Risk Free Rate,Dividened Yield data .. could u please send me one example file for the stock NIFTY ...
Regards
Peter November 16th, 2011 at 5:12pm
Hi Deepak,
You can use the spreadsheet on this page for any market - you just need to change the underlying/strike prices to the asset you want to analyze.
Deepak November 16th, 2011 at 9:34am
Hello Sir,
I am looking for some options hedge strategies with excels for working in Indian markets ... Please suggest ...
Regards
Peter October 30th, 2011 at 6:11am
Good evening.
NEEL 0512 October 30th, 2011 at 12:36am
HI PETER GOOD MORNING.
Peter October 5th, 2011 at 10:39pm
Ok, I see now. In Open Office you must first have JRE installed - Download Latest JRE.
Next, in Open Office, you have to select "Executable Code" in Tools -> Options -> Load/Save -> VBA Properties.
Let me know if this doesn't work.
Peter October 5th, 2011 at 5:47pm
After you have enabled Macros, save the document and re-open it.
Add a Comment