What is Volatility?
Volatility is a measurement of uncertainty. You've probably already heard this term in an every day setting where referencing a behavior can be said to be "so volatile". The context may have been an observed behavior that was referenced as being wild and unpredictable.
In finance it's the same concept; the behavior in our case is a stock's price movement where it can be said to be highly volatile if observed to be unstable and unpredictable.
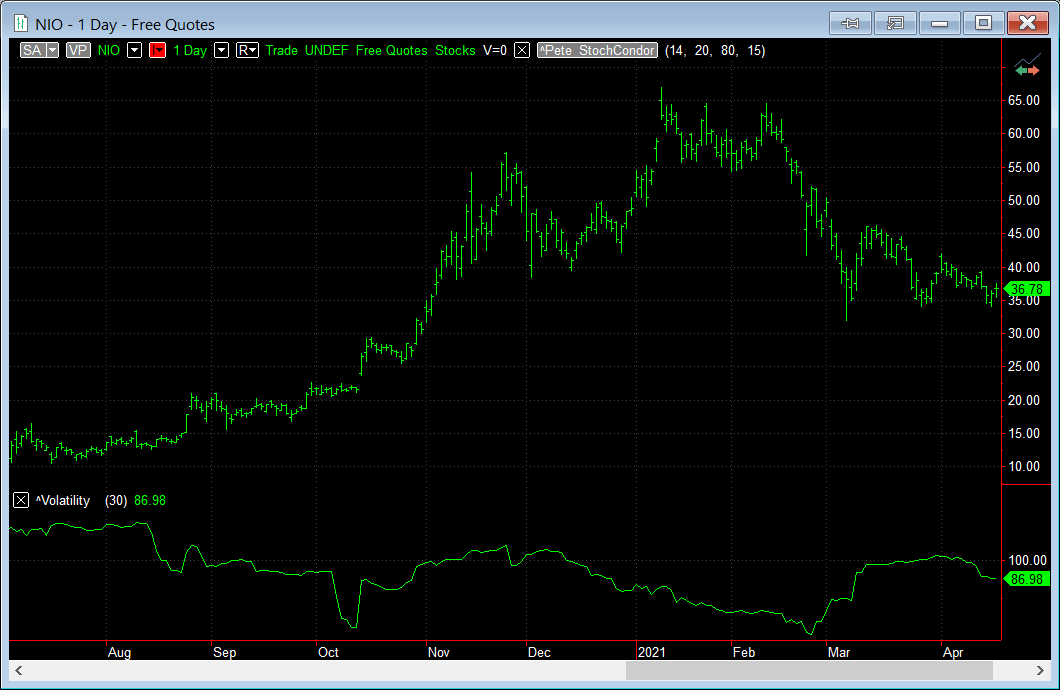
High Volatility
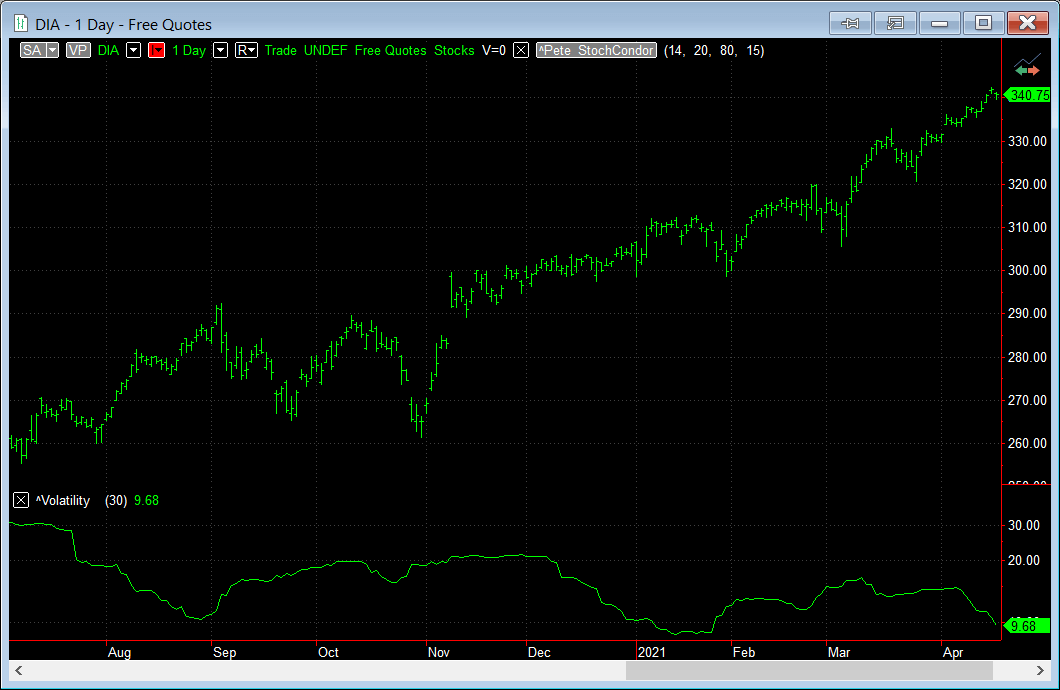
Low Volatility
The above examples show the difference between a stock that is highly volatile and one that exhibits low volatility.
While NIO's current vol is 87% it has spent almost a third of the time seen in the chart at or above 100% volatility. And the price range has gone from $10 to over $65 (+550%) in the same period.
Conversely, take a look at the Dow Jones ETF (DIA) pictured for the same range. It has a current vol of 10%, topping out at 30% but having a price range of $260 to $340 (+31%).
This is the type of impact that high volatility makes to stock prices.
Why is Volatility Important to traders?
Of all the inputs that go into valuing an option contract the two most uncertain factors are the underlying price itself and the volatility of the underlying. Or more specifically the volatility that is expected for the underlying from now until the expiration date (read about implied volatility next).
For option traders, volatility means opportunity. When considering the strike price of an out-of-the-money option contract, more volatility means more chances that the option will be profitable by the expiration date. For example, take NIO above. If you didn't have any insight into the volatility implied by the market prices, would you have bought a $50 call option that expires in 4 months with the stock trading at $12? It seems very unlikely to bet on the stock going up by 400% in that time. But when you know that prices are implying a volatility of 150% it makes the opportunity of that move seem more likely.
And because of the increase in likely hood that an option will be profitable, options that are perceived to have more chance of being in-the-money will be more valuable and hence the option premiums will be higher relative to a comparable stock that has low volatility.
Generally, higher volatility = higher option prices.
Implied Volatility vs Historical Volatility
When the volatility of the underlying is expected to the increase, the demand for these options increases their prices in the market. The volatility that is derived from the option bid/ask prices is called the implied volatility. Implied volatility is calculated from an option pricing model where instead of generating a theoretical price, the model uses the market price as the input and reverses the calculation to derive the volatility.
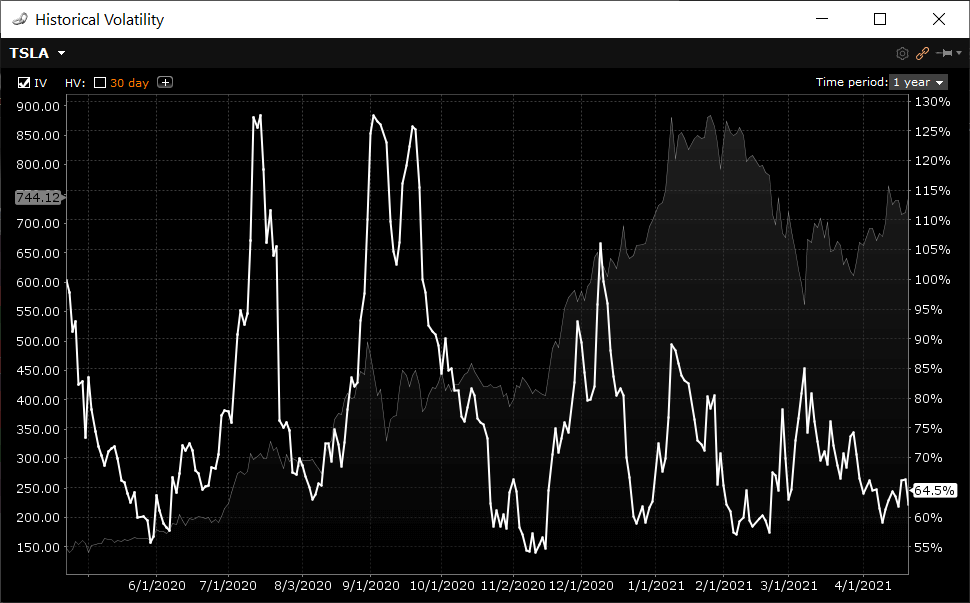
Historical Volatility
Is what's known as the "realized" or "statistical" volatility. It is taken from the closing prices of a stock and shows where the stock's volatility is currently at. Download my Excel sheet above for a sample of how this is calculated. Historical = past volatility.
Implied Volatility
Is derived from the market prices of the option contracts. Implied volatility is the estimate of where the market believes the stock's realized volatility will be from now until the expiration date of the option. Download my other option workbook for the method. Implied = future volatility.
Can you profit from Volatility?
You've probably laughed at the old adage of buying low and selling high when being referenced to trading stocks. What is high and low? A stock can't trade lower than zero but it can keep going up and up.
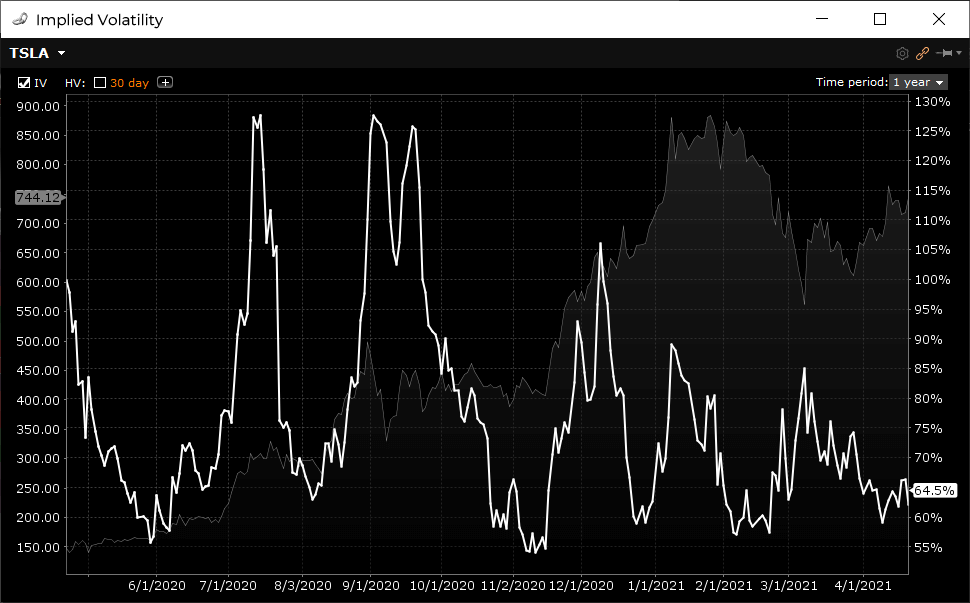
Volatility, however, tends to be a mean reverting asset. Not all of the time, but certainly enough of the time to justify using it in your decision making. Take a look at this selection of implied volatility graphs for stocks, index and commodity ETFs:
AMZN Stock
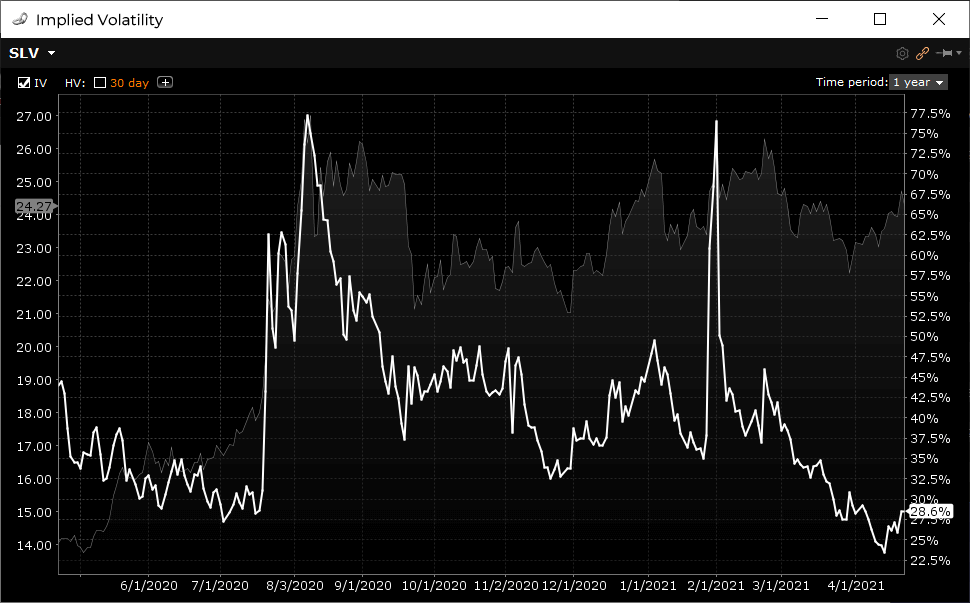
SLV ETF
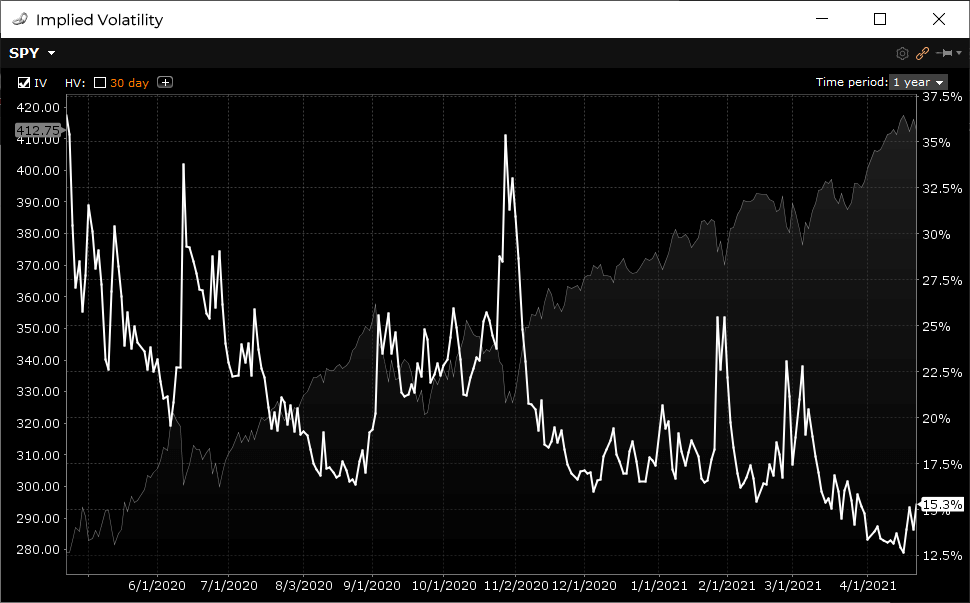
SPY ETF
TSLA Stock
I'm not saying that you can predict the direction of volatility at any point in time but the ebbs and flows of the movement tends to revert to an average, more often when volatility spikes; you will often see a huge bump in implied volatility followed by a drop in volatility.
These are opportunities many retail traders look for. That is - selling options when volatility is high (expensive) and buying options when volatility is low (cheap).
Earnings Plays and the IV Crush
Macroeconomic events and surprise company announcements are example drivers for increased volatility. But these types of events aren't know ahead of time.
But we do know when publicly traded companies release their earnings results; every quarter of every year.
Every 3 months the top companies go through periods of increased volatility in the lead up to their earnings announcements. Company results aren't fully known until publicly released, which in itself creates uncertainty. As unexpected results can cause massive price swings, option traders try and anticipate post earnings stock price movements, which drives up the prices (and hence implied volatility) of the options that expire after those earnings results.
The first thing new option traders think of when it comes to earnings plays are long straddles. That is, buying a call and a put at the same strike price, which creates an each way bet on the stock so that if it does move wildly in one direction you'll be covered either way. This isn't a bad idea in itself but straddles come at a cost as you're buying the options. This means that the stock has to move more than the strike price plus the total premium you've paid for the straddle. So, straddles are most effective when prices (and volatility) are low.
If volatility IS indeed low pre-earnings, then yes, long option strategies make sense.
However, what you'll notice is that most stocks experience increasing levels of volatility in the lead up to their earnings release. This volatility greatly inflates the option prices making strategies such as straddles much less attractive as the more you have to pay for a straddle increases your breakeven points - or increases the amount the stock has to travel before you start making any money.
So, what are the best pre-earnings plays?
The IV Crush
Take a look at this graph, which will help me explain what an IV Crush is:
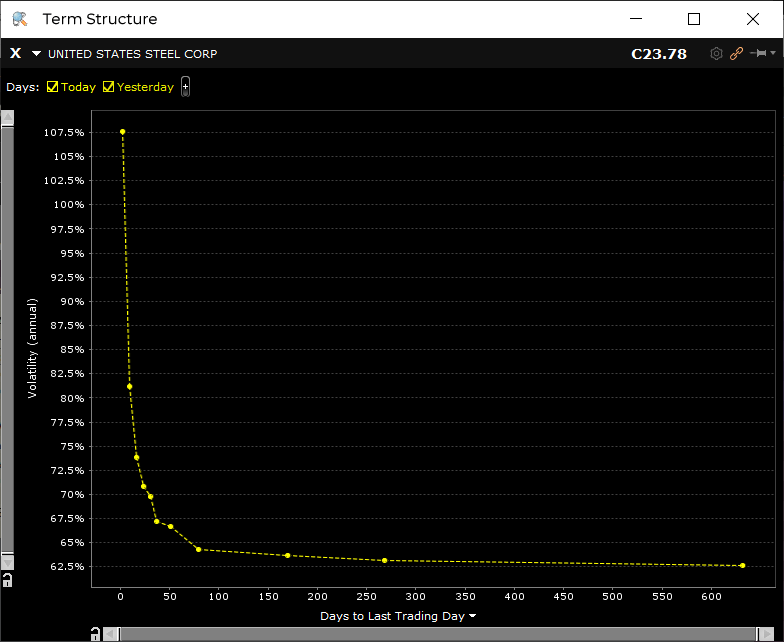
This is the at-the-money term structure for United States Steel (X). It plots the ATM volatility at each option expiration. This graph is telling you where the market believes volatility will be at each of the dates along the x-axis. Notice the massive spike 2 days out?
This spike is because United Steel are releasing their quarterly earnings numbers tomorrow after market. After the numbers are out and all the relevant information is now with the market, volatility is expected to drop in the following expirations.
This drop in volatility is what traders refer to as IV crush (implied volatility crush).
Option traders look to take advantage of the vol crush by using short option strategies prior to the announcement and then looking to exit or buy back the options immediately after the earnings are out.
These strategies are most effective when the stock price movement post earnings is less than the expected move as indicated by the implied volatility.
I would say that the two most common market neutral earnings plays are Short Iron Condor and Long Double Calendar spreads.
Both of these are labelled as market neutral, meaning, you're not bias in either direction regarding price movement. But both of these strategies require the underlying stock to stay within the upper bounds of the strike selection.
If the earnings numbers are a huge surprise to the market then these levels will be tested and could result in the strategy hitting its maximum threshold in one move.
I'm a bit cautious these days playing earnings due to the lottery style of trading it is; one day you're in the middle of a condor range and then next morning you're outside the long strike with little opportunity to adjust. That's the danger with these plays, so you have to but a bit careful in the selection of stocks and strikes.
Iron Condors and Double Calendars are a key strategy used in the Trading as a Business course found on this site. If you'd like to know more about if the members area can help you, send me an email and start a conversation.
PeterJanuary 15th, 2019 at 8:48pm
Hi Wayne,
Yes, I see the same problem for all symbols. Looks like Yahoo! have changed the format again. Let me look into it.
WayneDecember 12th, 2018 at 3:54pm
Great spreadsheet. I am trying to calculate the volatility for UNGS, a pinksheet stock. The stock is quoted on Yahoo Finance, but I get an error when using your spreadsheet.
Thanks
Wayne
PeterJune 24th, 2018 at 10:24pm
Strange...it just works for me. What symbol are you using?
Please send me an email here and I will reply with the spreadsheet as an attachment to check it's the same one.
LucianoJune 21st, 2018 at 8:41am
Thank you Peter,
unfortunately I still get the same error.
Regards. Luciano
Sean FallonJune 21st, 2018 at 12:28am
Hi Peter
Thanks for creating this spreadsheet, for us learners this is an excellent tool.
PeterJune 18th, 2018 at 7:25pm
Can you try again? I think the file may have been cached.
LucianoJune 18th, 2018 at 2:38am
Peter,
Thanks for your help,but also this spreadsheet does not work (symbol not found).
Regards.
Luciano
PeterJune 17th, 2018 at 11:26pm
Hi Luciano,
Yes, Yahoo! have been making some changes to their data format so it has been tricky to make it work. I've since had another change made that addresses the latest variation:
Historical Volatility
It is a lot slower than it used to be, but works at the moment.
LucianoJune 15th, 2018 at 9:02am
Hi Peter,
your historical volatility excel workbook does not work anymore.
I believe it's a yahoo problem.
Thank you if you have time to fix it.
Luciano.
PeterDecember 12th, 2017 at 10:20pm
Hi Rob,
Yes, it looks like Google have removed historical CSV downloads from their service too.
I will look into other sources of free data online to see if I can fix this.
RobDecember 12th, 2017 at 10:05am
The Excel Historical Volatility worksheet seems to have stopped working. It is giving "Error! Symbol not found."
Thank you if you are able to fix it.
PeterNovember 28th, 2017 at 8:18pm
Hi Pratik,
It works with whatever symbols Google provide for download via CSV. When you lookup a symbol in Google Finance and then click Historical Data, look for an Excel CSV icon to the right. If that is there then it will be able to be downloaded via the spreadsheet.
Google may add new markets symbols to their available list of downloads but at this stage it looks like only US symbols are supported.
You are welcome to copy/paste any data into the sheet and just re-use the formulas shown to suit. The Visual Basic code is also unlocked so you can modify that to suit another data source if you're good with VBA.
PratikNovember 27th, 2017 at 1:00pm
Works with US market listed symbols only? What to do if I want to look up and use symbol on Indian stock maret like NSE. Lets say I want to look up NIFTY index or Infosys on Indian market NSE.
How to import that data?
PeterSeptember 25th, 2017 at 8:26pm
Hi Melanie,
Yes, there was a change in the format of data provided by Google. A fix was made yesterday. If you download the file again it should work correctly. Let me know if you still have problems.
MelanieSeptember 25th, 2017 at 5:23pm
I am only able to get one year looking back worth of data from the day, even if i put the start date much earlier such as 2015. is anyone else having this problem? how do i fix.
PeterSeptember 12th, 2017 at 11:31am
Hi Kristine,
Yes, since Yahoo! removed support for the historical data many instruments are no longer available for download. Google's API doesn't provide as many symbols as Yahoo! Until I find another provider that supports all exchanges for free, I'm not sure what else you can do. Sorry about that!
KristineSeptember 11th, 2017 at 12:16pm
Greetings,
I have been using your Black Sholes calculator for years, however I haven't needed it for about 6 months.
I was surprised that it no longer works. I tried downloading the new one and using my code CVE:NCI, however I still get the message "Error Symbol not found" when I Extract Data.
Please help. This is an invaluable too for a small business like mine.
PeterJuly 17th, 2017 at 6:08am
Hi Rob,
Thanks for pointing it out! Someone else has reported it recently also. Not sure how to resolve this...I'll take a look soon though. Anyone with VBA skills that wants to take a look is more than welcome ;-)
RobJuly 14th, 2017 at 9:56am
Thank you for updating the spreadsheet, it is an amazingly useful tool.
Unfortunately, the update introduced a bug thanks to the way Google handles lightly traded stocks. If you use the symbol "ROSE" from 1/1/17 you will see the problem with the data Google sends back. On days with no trading the data reads "30-Jan-17,-,-,-,10.45,0" The "-" seems to trip-up your calculations.
I am not sure if this fix is easy or not, but it would be greatly appreciated.
Thanks
PeterJune 19th, 2017 at 1:23am
Hi Lakru,
When using Google, not all instruments are supported via their CSV download option. When checking a symbol on Google, go to Historical Prices and on the right hand side check for a Download CSV option...if it is not there, then the spreadsheet won't work. I know that currently, HK stocks aren't on provided via CSV. However, I noticed that ETFs weren't provided a couple of months ago but have since been added...so maybe it is a matter of time until they are added...
LakruJune 18th, 2017 at 4:05am
Hello, I have a problem with using the table. Whenever I press the "extract data" button, I get the following message: "Error! Symbol not found, or Yahoo! has changed the data format". I have selected Google as the source, I do not know why the message mentions Yahoo. Anyway, I have macros enabled and I am quite sure I use correct ticker name (eg. BABA).
PeterJune 1st, 2017 at 7:11pm
Hi Philip,
Mmm, doesn't look like Google likes the HK data when accessed this way. I used the same code i.e. HKG:0011 but it returns "Symbol not found". Let me look into it some more. Send me an email so I have your address and can reply if I find a way around it.
PhilipJune 1st, 2017 at 2:46am
Hello, may I know how your revised speadsheet calculate the volatililty for stock in Hong Kong, e.g. what to be inputted into the ticker cell for Hang Seng Bank stock with stock code 0011?
JohnMay 31st, 2017 at 6:03pm
Awesome! Thank you so much for the new Worksheet update. I love it and had been using this spreadsheet for years now since 2007. Greatly appreciate it.
PeterJuly 29th, 2010 at 6:31pm
Hi Luis,
Unfortunately Yahoo doesn't provide historical data for FOREX - only quotes.
As soon as Yahoo add support for this FOREX historical data will just work like stocks do now with the spreadsheet.
LuisJuly 29th, 2010 at 11:39am
Great job. How about a similar sheet for FX? Should be a simple modification to the macro, but it is protected.
Thanks
SAIFEEJune 25th, 2010 at 3:38am
VERY GOOD JOB DONE
PeterFebruary 2nd, 2010 at 4:47am
Hi Mike, the risk free rate is the current level of interest rates and dividend schedules/yields can be obtained from your broker.
MikeFebruary 1st, 2010 at 1:55pm
That would be on the "Basic" tab
MikeFebruary 1st, 2010 at 1:54pm
I am fairly new and was wondering where would I get the figures to enter into cell #'s C8 & C9?
PeterJanuary 14th, 2010 at 11:29pm
Mmm, works fine for me. What symbol are you trying? Can you retrieve that data directly from the Yahoo! site?
KyleJanuary 12th, 2010 at 6:50am
"Error! Symbol not found, or Yahoo! has changed the data format".
Have they changed the code?
PeterJanuary 11th, 2010 at 6:16am
Yep, the lookback period is configurable, so you can enter 100 if you like...I chose 50 as a default arbitary value.
MilosJanuary 11th, 2010 at 3:58am
Shouldn't the rolling window be bigger than 50? When the sample is small you can get evolution of volatility just by chance - Say you had one day very extraordinary large observation, this was in day 1, and on day 51 you have relatively small observation. Once you delete day one and add day 51 you have a change and volatility become time varying. I have seen that in other places 100 day rolling window is used, that is why I am asking
ArtunJanuary 5th, 2010 at 11:32pm
There are couple of obvious fixes required to fit into actual trading volatility calculation, I think the most obvious one is there are not 365 trading days, so you need to use 252 trading days for the sqrt part.
DaveNovember 7th, 2009 at 12:30pm
Peter - You're welcome. I thought that might be the case. The Offset() method of defining a range is an incredibly powerful tool, one which seems to be little known or used, even among savvy Excel users. I was one of them ... a whole new world was opened to me when I "discovered" it. Keep up the good work! Dave
PeterNovember 5th, 2009 at 2:41pm
Hi Dave,
Volatility Days certainly is used in the calculation...it's written into the Macro...not in the formula. When you hit the "Extract Data" button the array for the volatility calculation changes according to what you've entered into the "Volatility Days" cell.
Having said that...I do appreciate your formula below. The reason I included it in the Macro was because I didn't know how to do it with a formula ;-) But now I know, thanks a lot...very useful!
DaveNovember 5th, 2009 at 11:05am
Wont' accept less than symbol. =IF(ROW() is less than (Days+11),"",STDEV(OFFSET(C100,0,0,-Days,1))*SQRT($B$2)). Copy it to all the cells in column D.
DaveNovember 5th, 2009 at 11:00am
=IF(ROW()<Days+11,"",STDEV(OFFSET(C100,0,0,-Days,1))*SQRT($B$2)) and copy it to all the cells in column D.
DaveNovember 5th, 2009 at 10:57am
Clearly the "Volatiliy Days" variable isn't used in the volatility calculations, but it can be. Assign the name "Days" to cell B3, then relace the formulas in cell D100 with =IF(ROW()<Days+11,"",STDEV(OFFSET(C100,0,0,-Days,1))*SQRT($B$2)) and copy it to all the rest of the relevant cells in column D. Now you can vary the number of volatility days and the volatility will change accordingly.
Alan ChuaOctober 19th, 2009 at 4:03pm
Thanks so much Peter for a job well done. Your spreadsheet has helped me track volatility with ease.
PeterOctober 13th, 2009 at 7:05am
Thanks very much for the positive feedback engineer!
engineerOctober 12th, 2009 at 3:25am
This website describes the formula in depth and with details links.
http://www.neuralmarkettrends.com/2007/05/29/calculating-historical-volatility/
engineerOctober 12th, 2009 at 3:20am
I am an engineer and was studying pricing movement.
I used and applied the online formula found on googling historical volatility formula.
I was trying to compare my result with yours.
thanks for the great work. I like your chart.
I tried other place like Ivolatility.com
but it is a joke nowaday that they force people to sign up just to get a stock quote. and they try to charge you money for data download for historical volatility where people can use yours spreadsheet or programmers like us that can generate it from google or yahoo finiance api using very simple and basic programming calculation.
samanthaOctober 9th, 2009 at 2:25pm
thanks very much for sharing this.
Great spreadsheet
Happy Trading!
Kenneth K. SeibelSeptember 25th, 2009 at 12:09pm
Thanks a bunch for sharing your spreadsheet - you saved me many hours of work and your version is better taht the one I had intended to create!
PeterSeptember 14th, 2009 at 6:25am
Thanks Hazem! You could check out iVolatility.com.
HazemSeptember 13th, 2009 at 11:36am
Great stuff... thanks for doing this and for sharing...
I have a macbook and vb macros don't work on mac office. Is there any other alternative? An online version or something?
Thanks...
AydinAugust 27th, 2009 at 4:14am
Thanx!
PeterJuly 10th, 2009 at 7:32am
Hi Aydin, try this:
http://www.willowsolutions.com/tips/tips_2002_08.shtml
It does the same thing.
AydinJuly 2nd, 2009 at 5:39am
I appreciate your effort for the excel. Nice job... Can I please get the VBA password :)))
PeterJune 6th, 2009 at 5:49am
Hi Michael,
That's a good question and to be honest I've never thought about it before ;-). All the stats books I've looked at always used STDEV only...perhaps because the data used is only a sample dataset. I believe STDEVP is used when the population data is 100% complete.
What are your thoughts? Do you think STDEVP is a better alternative?
MichaelJune 5th, 2009 at 9:34pm
Fantastic product! I really appreciate this...I just have one question: Why do you use sample standard deviation when computing volatility as opposed to standard deviation of the population (excel function: stdevp)
PeterMarch 31st, 2009 at 8:07pm
Hi Ben, I plan to release the source code in the future, however, for the time being it is locked. You can check out a similar example from:
http://www.willowsolutions.com/tips/tips_2002_08.shtml
BenMarch 31st, 2009 at 1:23pm
How did you create the Macro that downloads data from Yahoo!?
JoeyJanuary 17th, 2009 at 6:38pm
really appreciate this - Thank You! (the excel spreadsheet is especially helpful)
Dominique NguyenNovember 25th, 2008 at 2:23am
That's great. Thanks a lot for your work.
Add a Comment