Excel Option Pricer
Excel based Black and Scholes calculator for European stock/index options and American options using dividend yields.
Theoretical Price and Option Greeks Support
Implied Volatility Calculator
Configurable Payoff Graphs
Option Strategy Construction
VBA used is Unlocked and Editable
Grab Your Free Copy
My option pricing spreadsheet will allow you to price European call and put options using the Black and Scholes model.
Understanding the behavior of option prices in relation to other variables such as underlying price, volatility, time to expiration etc is best done by simulation. When I was first learning about options I began building a spreadsheet to help me understand the payoff profiles of calls and puts and also what the profiles look like of different combinations. I've uploaded my workbook here and you're welcome to it.
Simplified
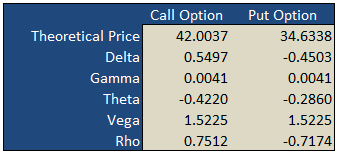
On the "basic" worksheet tab you will find a simple option calculator that generates fair values and option Greeks for a single call and put according to the underlying inputs you select. The white areas are for your user input while the shaded green areas are the model outputs.
Implied Volatility
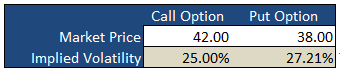
Underneath the main pricing outputs is a section for calculating the implied volatility for the same call and put option. Here, you enter the market prices for the options, either last paid or bid/ask into the white Market Price cell and the spreadsheet will calculate the volatility that the model would have used to generate a theoretical price that is in-line with the market price i.e. the "implied" volatility.
Payoff Graphs
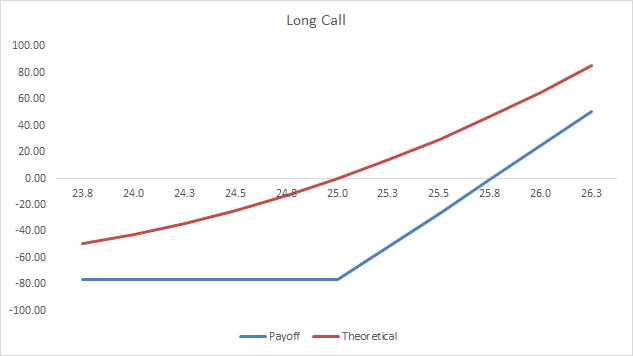
The PayoffGraphs tab gives you the profit and loss profile of basic option legs; buy call, sell call, buy put and sell put. You can change the underlying inputs to see how your changes effect the profit profile of each option.
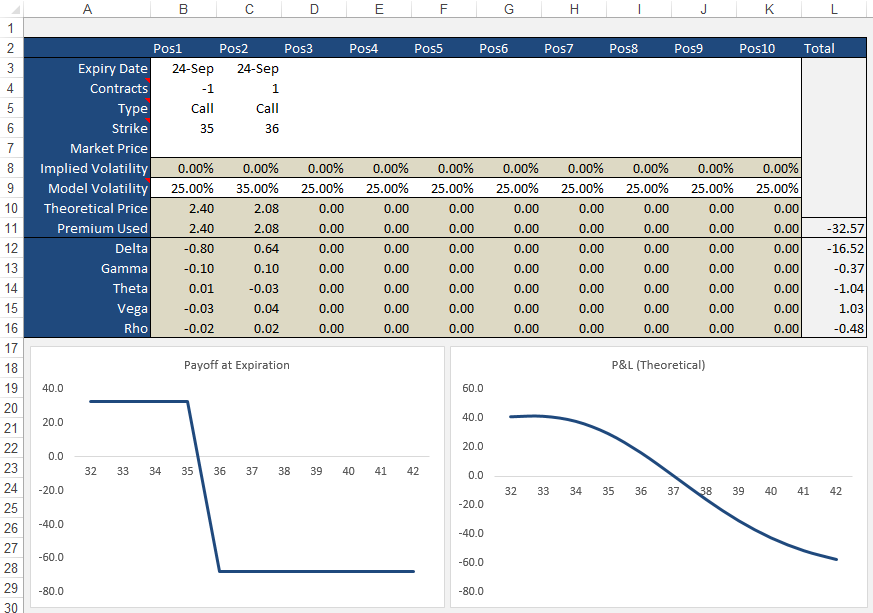
Strategies
The Strategies tab allows you to create option/stock combinations of up to 10 components. Again, use the while areas for your user input while the shaded areas are for the model outputs.
Formulas
Theoretical and Greek Prices
Use this Excel formula for generating theoretical prices for either call or put as well as the option Greeks:
- Type
- c = Call, p = Put, s = Stock
- Output
- p = theoretical price, d = delta, g = gamma, t = theta, v = vega, r = rho
- Underlying Price
- The current market price of the stock
- Exercise Price
- The exercise/strike price of the option
- Time
- Time to expiration in years e.g. 0.50 = 6 months
- Interest Rates
- As a percentage e.g. 5% = 0.05
- Volatlity
- As a percentage e.g. 25% = 0.25
- Dividend Yield
- As a percentage e.g. 4% = 0.04
A Sample formula would look like =OTW_BlackScholes(c, p, 25, 26, 0.25, 0.05, 0.21, 0.015).
Implied Volatility
Same inputs as above except:
- Market Price
- The current market last, bid/ask of the option
Example: =OTW_IV(p, 100, 100, 0.74, 0.05, 8.2, 0.01)
Support
If you're having troubles getting the formulas to work, please check out the support page or send me an email.
If you're after an online version of an option calculator then you should visit Option-Price.com
Just to note that much of what I have learnt that made this spreadsheet possible was taken from the highly acclaimed book on financial modeling by Simon Benninga - Financial Modeling - 3rd Edition
If you're an Excel junkie, you'll love this book. There are loads of real world problems that Simon solves using Excel. The book also comes with a disk that contains all the exercises Simon illustrates. You can find a copy of Financial Modeling at Amazon of course.
sachinApril 19th, 2020 at 5:27am
Hi There,
Could anybody please paste the VCG scripts here?
OR
GS script compatible modules please?
Thanks,
Sachin
JulioJune 22nd, 2019 at 2:43pm
Man! Outstanding tool! Thanks man!
PeterJune 18th, 2019 at 4:58am
Hi Suresh,
Yes, you can download the non-VBA version here:
Black Scholes Excel Only
it is from the Black and Scholes Page.
SureshJune 16th, 2019 at 11:51am
Hi , Thank you very much for the workbook. Do you have a excel book without VBA code? to understand the formulas? if yes can you please share?
PeterApril 23rd, 2019 at 12:14am
Hi Deepak,
Apologies for the delay; I've been away on vacation.
The current version doesn't calculate intra-day values, however, it can do it and is easy to modify it.
In the Excel formula you will notice that I take today's date from the expiration date and divide that number by 365 to give the time in years. You can simply create a new cell, or modify the formula directly to use intra-day values. For example, if there was half a day left to expiration you would use 0.00136986 (0.50 / 365) in the formula.
DeepakApril 18th, 2019 at 3:45pm
Hi Peter,
Thanks for making your spreadsheet available.
Does it work for looking at options PL at different times intraday? How would you input the time remaining?
And how accurate is the model for options pricing in the last day before expiration?
Thanks.
PeterFebruary 19th, 2017 at 4:47pm
Hi Luciano,
1) The spreadsheet here calculates the option greeks. In the Excel formula OTW_BlackSholes() just modify the second input from "p" to either "d", "g", "t", "v" or "r" (without quotes).
2) Yes, the greeks for a strategy is the sum of the individual legs.
LucianoFebruary 19th, 2017 at 11:27am
Hello Peter,
I got two questions.
1) Do you know where I can get an add in for excel to calculate option greeks?
2) How do I calculate the greeks of a multiple legs strategy? E.g.Is the "total" delta the sum of the single legs deltas?
Thank you and regards.
Luciano.
PeterJanuary 12th, 2017 at 5:23pm
Hi Mike,
Thanks for the feedback, appreciate it!
I see what you mean, however, as stocks don't carry a contract size I left this out of the payoff calculations. Instead, the correct way to account for this when comparing stocks with options is to use the appropriate amount of shares that the option represents i.e. for a Covered Call, you would enter 100 for the volume of shares for every 1 option contract sold. If you were to use 1 for 1 it would imply that you only bought 1 share.
Up to you though...if you prefer to embed the multiplier into the calculations and use single units for the stock, that's fine too. I just like to see how many shares/contracts I am buying/selling.
Is this what you mean...I hope I've not misunderstood you?
Mike CJanuary 12th, 2017 at 6:26am
FYI,
You have an error in your spread sheet depending on how you look at it. It involves the theoretical graph vs the payoff graph with a stock position involved.. For your payoff you id the leg as stock and do not use the option multiplier. For the theo and greek graph you always multiplying by the "multiplier" even for stock legs so your calculations are off by a factor of the "multiplier".
PS Do you still maintain this? I have expanded it and can contribute if you are.
Mike
PeterDecember 14th, 2016 at 4:57pm
Hi Clark,
The arrows change the Date Offset value in cell P3. This enables you to view the changes to the theoretical value of the strategy as each day passes.
ClarkDecember 14th, 2016 at 4:12am
What are the up/down arrows supposed to do on strategies page?
PeterOctober 7th, 2014 at 6:21am
Hi Denis,
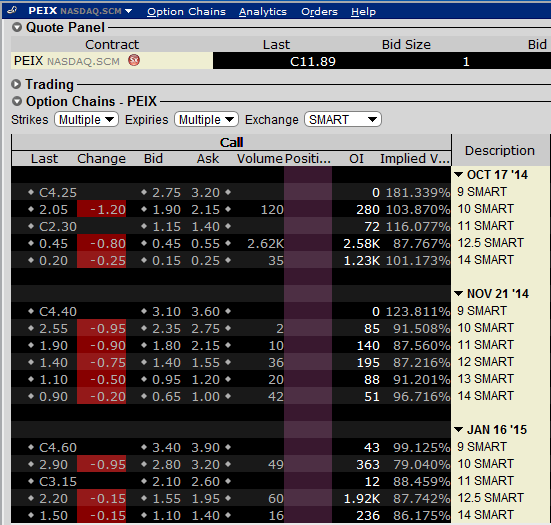
I used 5 just to ensure there was enough buffer to handle high volatilities. 200% IV's aren't that uncommon - even just now, looking at PEIX the $9 October strike is showing 181% on my broker terminal.
But, of course, you're welcome to change the upper value if a lower number improves performance for you. I just used 5 for ample room.
Regarding the historical volatility, I would say the typical use is close to close. Take a look at my Historical Volatility Calculator for an example.
DenisOctober 7th, 2014 at 3:07am
Hi Peter,
Just a simple question, I am wondering why ImpliedCallVolatility & ImpliedPutVolatility has a "high = 5" the highest volatility I see is about 60%
Therefore wouldn't setting "high = 2" make more sense. I know it doesn't make much difference to speed, but I tend to be pretty precise when it comes to programming.
On another note, I am having a hard time figuring out what Historical Volatility of the underlying assets. I know some people use close-to-close, average of high&low, also different moving averages like 10-day, 20-day, 50-day.
PeterJune 10th, 2014 at 1:09am
Hi Jack,
Thanks for posting!
I appreciate you posting the numbers in the comment, however, it's hard for me to make sense of what is going on. Is it possible for you to email me your Excel sheet (or modified version of) to "admin" at this domain? I'll take a look and let you know what I think.
Jack FordJune 9th, 2014 at 5:32am
Sir,
In the Option Trading Workbook.xls OptionPage.
I changed the underling price and strike price to calculate the IV,
as below.
7,000.00 Underlying Price
24-Nov-11 Today's Date
30.00% Historical Volatility
19-Dec-11 Expiry Date
3.50% Risk Free Rate
2.00% Dividend Yield
25 DTE
0.07 DTE in Years
Theoretical Market Implied
Strike Prices Price Price Volatility
6,100.00 ITM 912.98 999.00 57.3540%
6,100.00 ITM 912.98 912.98 30.0026%
6,100.00 ITM 912.98 910.00 27.6299%
6,100.00 ITM 912.98 909.00 26.6380%
6,100.00 ITM 912.98 0.0038%
6,100.00 ITM 912.98 907.00 24.0288%
6,100.00 ITM 912.98 906.00 21.9460%
6,100.00 ITM 912.98 905.00 0.0038%
6,100.00 ITM 912.98 904.00 0.0038%
6,100.00 ITM 912.98 903.00 0.0038%
6,100.00 ITM 912.98 902.00 0.0038%
My question is : When the market price was changed from 906 to 905, why
the IV was changed so dramatically?
I like your web and excel workbook very much, they are the best in the
market!
Thank you very much!
PeterJanuary 10th, 2014 at 1:14am
Hi CDT,
Yes, the fucntions I created using a macro/module.
There is a formula only version on this page;
Black Scholes
Let me know if this works.
cdtJanuary 9th, 2014 at 10:19pm
I tried the spreadsheet in Openoffice, but it did not work. Does that use Macros or imbedded functions?
I was looking for something without macros, since my openoffice does not usually work with Excel macros.
Thanks for any possible help.
RaviJune 3rd, 2013 at 6:40am
Can you please let me know how we can calculate Risk Free Rate in case of USDINR Currency Pair or any other pair in general.
Thanks in Advance.
PeterMay 28th, 2013 at 7:54pm
Hi Max,
Mmm, not really. You can change the volatility back and forth but the current implementation doesn't plot greeks vs volatility.
You can check out the online version;
Option-Price.com
It has a simulation table at the end of the page that plots greeks vs both price and volatility.
maxMay 24th, 2013 at 8:51am
Hello, what a great file!
I am trying to see how the volatility skew affects the greeks, is it possible to do this on the OptionsStrategies page?
Thank you
Max
PeterApril 30th, 2013 at 9:38pm
Hi Wong,
Yes, your numbers sound right. What worksheet are you looking at and what values are you using? Perhaps you could email me your version and I can take a look? Maybe you're looking at the P&L that includes time value - not the payoff at expiration?
wongApril 28th, 2013 at 9:05pm
hi, thanks for the worksheet. However, I am troubled by the calculated P/L on expiration. It should be made of two straight lines,joined at the strike price, right? but I did not get that. For example, for a put with strike $9, premium used is $0.91, the P/L for underlying price of 7, 8, 9, 10 were 1.19, 0.19, -0.81, -0.91, when they should be 1.09, 0.09, -0.91, -0,91, isn't that correct?
PeterApril 15th, 2013 at 7:06pm
Mmm...the average volatility is mentioned in cell B7 but not graphed. I didn't want to graph it as it would just be a flat line across the graph.
You're welcome to add it though - just email me and I'll send you the unprotected version.
RyanApril 12th, 2013 at 9:11am
Sorry, I reread my question and it was confusing.. I'm just wondering if there is a way to also throw in Avg Volatility into the graph?
PeterApril 12th, 2013 at 12:35am
Hi Ryan,
Not sure if I understand correctly. The current volatility is what is graphed - the volatility calculated each day for the time period specified.
RyanApril 10th, 2013 at 6:52pm
Hi,
Great volatility spreadsheet.. I'm wondering if its at all possible to track what the 'current' volatility is. Meaning just like your Max and Min are plotted on the chart, is it possible to add current, so we can see how its changed? If its not at all possible, do you know a program or willing to code this?
Thanks, Ryan
PeterMarch 21st, 2013 at 6:35am
Hi Desmond,
The VBA is unlocked - just open the VBA editor and all of the formulas are there.
Desmond March 21st, 2013 at 3:16am
can i know the formular in deriving the Theoretical Price in the basic tab
PeterDecember 27th, 2012 at 5:19am
Hi Steve,
No, not yet, however, I found this site, which seems to have one;
Binary Options Excel
Let me know if it's what you're after.
SteveDecember 16th, 2012 at 1:22pm
Terrific spreadsheets - thanks much!
Do you by any chance have a way to calculate theo prices for the new binary options (daily expriations) based on the Index futures (ES, NQ, etc.) that are traded on NADEX and other exchanges?
Thank you so much for your current spreadsheets - very easy to use and so so helpful.
-S
PeterOctober 29th, 2012 at 11:05pm
Hi Vlad,
Thanks for writing.
The VBA I used for the calculations are open for you to look/modify as needed inside the spreadsheet.
The formula I used for Theta is;
CT = -(UnderlyingPrice * Volatility * NdOne(UnderlyingPrice, ExercisePrice, Time, Interest, Volatility, Dividend)) / (2 * Sqr(Time)) - Interest * ExercisePrice * Exp(-Interest * (Time)) * NdTwo(UnderlyingPrice, ExercisePrice, Time, Interest, Volatility, Dividend)
CallTheta = CT / 365
VladOctober 29th, 2012 at 9:43pm
Greetings,
I would like to know how you calculated the theta on a basic call option. I virtually got the same answers to you but the theta in my calculation is way off. Here are my assumptions..
Strike Price $40.0
Stock Price $40.0
Volatility 5.0%
Interest Rate 3.0%
Expiration in 1.0 month(s) 0.1
D1 0.18
D2 0.16
N(d1) 0.57
N(d2) 0.56
My Call Option Your Answer
Delta 0.57 0.57
Gamma 0.69 0.69
Theta -2.06 -0.0056
Vega 0.04 0.04
Rho 0.02 0.02
Option $0.28 $0.28
Thuis is the formula I have for theta in excel which gives me -2.06.
=(-1*((Stock Price)*((1/(SQRT(2*PI())))*EXP(-1*(((D1^2)/2))))*Volatility)/(2*SQRT(Months))) - Interest Rate*Strike Price*EXP(-Interest Rate*Months)*N(d2.
Thank you for taking the time to read this, look forward to hearing from.
Regards,
Vladmir
PeterJune 4th, 2012 at 12:34am
Hi Zoran,
Margin and premium are different. A margin is a deposit that is required to cover any losses that may occur due to adverse price movements. For options, margins are required for net short positions in a portfolio. The amount of margin required can vary between broker and product but many exchanges and clearing brokers use the SPAN method for calculating option margins.
If your option position is long, then the amount of capital required is simply the total premium paid for the position - i.e. margin will not be required for long option positions.
For futures, however, a margin (typically called "initial margin") is required by both long and short positions and is set by the exchange and subject to change depending on market volatility.
zoranJune 1st, 2012 at 11:26pm
Hello, as I am new in trading options on futures please explain to me how to calculate margin, or daily premium, on Dollar Index, as I saw on the ICE Futures US web page, that the margin for the straddle is only 100 Dollars. It is so cheap that if I bought call and put options with the same strike, and form the straddle, it is look profitable to exercise early one leg of the position? I have in my account 3000 dollars.
Sincerely, Zoran
PeterMay 21st, 2012 at 5:32am
Hi B,
iVolatility have FTSE data but charge $10 a month to access European data. They have a free trial though so you can see if it is what you need.
BMay 21st, 2012 at 5:02am
Hi ,
Any one knows how we can get FTSE 100 index Historical volatility
Regards,
B
PeterApril 3rd, 2012 at 7:08pm
Hi Darong,
I don't think VWAP is used by option traders at all...VWAP would more likely be used by institutional traders/fund managers who execute large orders over the course of the day and want to make sure that they are better than the average weighted price over the day.
You would need accurate access to all the trade information in order to calculate it yourself so I would say that traders would obtain it from their broker or other vendor.
DarongApril 3rd, 2012 at 3:41am
Hi Peter,
I have a quick question as I just started to study Options...
For VWAP, normally, do option traders calculate it by themselves or tend to refer to calculated value by information vendors, or etc.? I want to know about market convention from traders' perspectives as a whole for option trading.
Appreciate if you revert to me.
Regards,
pintoo yadavMarch 29th, 2012 at 11:49am
this is program in well mannered but required macros to be enabled for its work
PeterMarch 26th, 2012 at 7:42pm
Hi Amitabh,
I suppose for short term trading the payoffs and strategy profiles become irrelevant. You'll just be trading off short term fluctuations in price based off expected movements in the underlying.
AmitabhMarch 15th, 2012 at 10:02am
Hi Peter
How can this good work of yours be used for intraday or short term trading of options as these options make short-term tops and bottoms. Any strategies for same?
Warm wishes
Amitabh Choudhury
[email removed]
madhavanMarch 13th, 2012 at 7:07am
First time I am going through any useful write up on option trading. Liked very much. But have to make an indepth study to enter into trading.
Jean charlesFebruary 10th, 2012 at 9:53am
Hi Peter,
I have to say your website is great ressource for option trading and carry on. I was looking for your worksheet but for forex underlying instrument. I saw it but You don't offer to download.
[email removed]
PeterJanuary 31st, 2012 at 4:28pm
Do you mean an example of the code? You can see the code in the spreadsheet. It is also written on the Black Scholes page.
dilip kumarJanuary 31st, 2012 at 3:05am
Hi
please give example.
PeterJanuary 31st, 2012 at 2:06am
You can open the VBA editor to see the code used to generate the values. Alternatively you can look at the examples on the black scholes model page.
iqbalJanuary 30th, 2012 at 6:22am
Hi,
How is it that I can see the actual formula behind the cells that you have used to obtain the data? Thank you in advance.
PeterJanuary 26th, 2012 at 5:25pm
Hi Amit, is there an error that you can provide? What OS are you using? Have you seen the Support Page?
amitJanuary 25th, 2012 at 5:56am
hi..
The workbook is not opening....
sanjeevDecember 29th, 2011 at 10:22pm
thanks for the workbook.
could you please explain me risk reversal with one or two examples?
PDecember 2nd, 2011 at 10:04pm
Good day. Indian man trading today Found spreadsheet but does work? Look at it and needs fix to fix problem?
akshayNovember 29th, 2011 at 11:35am
hello sir,
i am new to options and want to know how options pricing can help us...??
DeepakNovember 17th, 2011 at 10:13am
Dear Sir ,
thanks for the reply .. but i am not able to collect the Historical Volatility , Risk Free Rate,Dividened Yield data .. could u please send me one example file for the stock NIFTY ...
Regards
PeterNovember 16th, 2011 at 5:12pm
Hi Deepak,
You can use the spreadsheet on this page for any market - you just need to change the underlying/strike prices to the asset you want to analyze.
DeepakNovember 16th, 2011 at 9:34am
Hello Sir,
I am looking for some options hedge strategies with excels for working in Indian markets ... Please suggest ...
Regards
PeterOctober 30th, 2011 at 6:11am
Good evening.
NEEL 0512October 30th, 2011 at 12:36am
HI PETER GOOD MORNING.
PeterOctober 5th, 2011 at 10:39pm
Ok, I see now. In Open Office you must first have JRE installed - Download Latest JRE.
Next, in Open Office, you have to select "Executable Code" in Tools -> Options -> Load/Save -> VBA Properties.
Let me know if this doesn't work.
PeterOctober 5th, 2011 at 5:47pm
After you have enabled Macros, save the document and re-open it.
KyleOctober 5th, 2011 at 3:24am
Yes, was receiving a $MARCOS? and $NAME? error. I have enabled the marcos, but still getting the $NAME? error. Thanks for your time.
PeterOctober 4th, 2011 at 5:04pm
Yes, it should work. Are you having troubles with Open Office?
KyleOctober 4th, 2011 at 1:39pm
I was wondering if this spreadsheet can be opened with open office? If so how would i go about this?
PeterOctober 3rd, 2011 at 11:11pm
Hi NK,
Whatever money costs you (i.e. to borrow) is your interest rate.
If you want to calculate the historical volatility for a stock then you can use my historical volatility spreadsheet.
You will also need to consider dividend payments if this is a stock that pays dividends and enter the effective yearly yield in the "dividend yield" field.
The prices don't have to match. If the prices are out, this just means that the market is "implying" a different volatility for the options than what you have estimated in your historical volatility calculation. This could be in anticipation of a company announcement, economic factors etc.
NKOctober 1st, 2011 at 11:59am
Hi, i'm new to options. I'm calculating the Call and Put premiums for TATASTEEL(I used American Style options calculator). Date - 30 Sept, 2011.
Price - 415.25.
Strike price - 400
Interest rate - 9.00%
Volatility - 37.28%(I got this from Khelostocks.com)
Expiration Date - 25 Oct
CALL - 25.863 PUT - 8.335
Are these values correct or do i need to change any input parameters.
Also plz tell me what to put for Interest rate and from where to get the volatility for particular stocks in calculation.
The current price for the same options are
CALL - 27 PUT - 17.40.
Why is there such a difference and what should be my trading strategy in these?
PeterSeptember 8th, 2011 at 1:49am
Yes, it is for European options so it will suit the Indian NIFTY index options but not the stock options.
For retail traders I would say that a B&S is close enough for American options anyway - used as a guide. If you're a market maker, however, you would want something more accurate.
If you're interested in pricing American options you can read the page on the binomial model, which you'll also find some spreadsheets there.
Mehul NakarSeptember 8th, 2011 at 1:23am
is this File Made in European style or American style option
How to USE in INDIA market
as Indian OPTIONS are trading in American style
can u make it American style model for Indian market user???
thanks in advance
MahajanSeptember 3rd, 2011 at 12:34pm
Hi Peter,
Sorry for the confusion, but i am looking for some volatility formula only for futures trading (and not options).Can we use historical volatility in futures trading ? Any source/link you have, will be a great help to me.
Regards,
Mahajan
PeterSeptember 3rd, 2011 at 6:05am
Hi Gina,
15 points is the profit of the spread, yes, but you have to subtract the price that you have paid for the spread, which I assume is 5 - making your total profit 10 instead of 15.
PeterSeptember 3rd, 2011 at 6:03am
Hi Mahajan,
Do you mean options on futures or just straight futures?
The spreadsheet can be used for options on futures but is not useful at all if you are just trading outright futures.
Gina September 2nd, 2011 at 3:04pm
If you look at Dec 2011 PUTs for netflix - I have a put spread - short 245 and long 260 - why doesn't this reflect a profit of 15 instead of 10?
Any idea?
Gina
MahajanSeptember 2nd, 2011 at 6:58am
Hi Peter,
First of all tons of thanks for providing the useful excel.I am very new to options (previously i was trading in commodities futures).Can you please help me in understanding, how i can use these calculations for future trading(silver,gold,etc) ?
If there is any link please provide me the same.
Thanks again for enlightening thousand of traders.
Cheers,
Mahajan
PeterAugust 26th, 2011 at 1:41am
Hi Edwin,
There isn't currently a sheet specifically for calendar spreads, however, you're welcome to use the formulas provided to build your own with the parameters needed.
You can email me if you like and I can try and help you with an example.
Edwin CHU (HK)August 26th, 2011 at 12:59am
I am an active options trader with my own trade boob, I find your worksheet "Options Strategies quite helpful, BUT, can it cater for calendar spreads, I caanot find a clue to insert my positions when faced with options and fut contracts of different months?
Look forward to hearing from you soon.
PeterJune 28th, 2011 at 6:28pm
Oh, use the Contact Form.
SunilJune 28th, 2011 at 11:42am
on which mail id should i send ?
PeterJune 27th, 2011 at 7:07pm
Hi Sunil, send me an email and we can take it the conversation offline.
SunilJune 27th, 2011 at 12:06pm
Hi Peter, many thanks. I had gone through the VB functions but they use many inbuild excel functions for calculations. I wanted to write the program in Foxpro (old time language) which does not have the inbuild functions in it and hence was looking for basic logic in it. Never the less, the excel is also very useful, which i don't think anyone else has also shared on any site.
I went through the complete material on Options and you have really done a very good knowledge sharing on Options. You have really discussed in depth near about 30 strategies....Hats off. Thanks
PeterJune 27th, 2011 at 6:06am
Hi Sunil, for Delta and Implied Volatility the formulas are included in the Visual Basic provided with the spreadsheet at the top of this page. For Historical Volatility you can refer to the page on this site on calculating volatility. However, I am not sure on the profit probability - do you mean the probability that the option will expire in the money?
SunilJune 26th, 2011 at 2:24am
Hi Peter,
How do i calculate the following. I want to write a program to run it on various stocks at a time and do first level scanning.
1. Delta
2. Implied volatility
3. Historical Volatility
4. Profit Probability.
can you please guide me on the formulas.
PeterJune 18th, 2011 at 2:11am
Pop up? What do you mean?
sharkJune 17th, 2011 at 2:25am
where is the pop up
PeterJune 4th, 2011 at 6:46am
Hi DevRaj,
You can try my volatility spreadsheet that will calculate the historical volatility that you can use in the option model.
DevRajJune 4th, 2011 at 5:55am
Very useful nice article and the excel is very good
Still one question
How to calculate volatility using (option price, spot price, time )
?
SatyaMay 10th, 2011 at 6:55am
Hi Peter,
I have just started using the spreadsheet provided by you for option trade. A wonderful easy to use stuff with adequate tips for easy usage.
Thanks for your best efforts to help educate the society.
Regards
Satya
PeterMarch 28th, 2011 at 4:43pm
It works for any European option - irrespective of the country where the options are traded.
EmmaMarch 28th, 2011 at 7:45am
Do you have it for Irish stocks???
PeterMarch 9th, 2011 at 9:29pm
Hi Karen, those are some great points!
Sticking to a system/methodology is very hard...it is easy to be distracted by all of the offers out that are out there.
I am looking closely at a few option picking services right now and plan to list them on the site if they prove to be successful.
Karen OatesMarch 9th, 2011 at 8:51pm
Is your option trading not working because you haven't found that right system yet or because you won't stick to one system?
What can you do to find the right system and then stick to it?
Could a lot of what is not working for you be because of how you are thinking? Your beliefs and mindset?
Working on improving yourself will help all areas of your life.
PeterJanuary 20th, 2011 at 5:18pm
Sure, you can use implied volatility if you like. But the point of using a pricing model is for you have your own idea of volatility so you know when the market is "implying" a value different to your own. Then, you are in a better position to determine if the option is cheap or expensive based on historical levels.
The spreadsheet is really more of a learning tool. To use implied volatilities for the greeks in the spreadsheet would require the workbook to be able to query option prices online and download them to generate the implied volatilities. That's why I have unlocked the VBA code in the spreadsheet so that users can customize it to their exact needs.
t castleJanuary 20th, 2011 at 12:50pm
The Greeks that are calculated on the OptionPage tab of OptionTradingWorkbook.xls appear to be dependent on Historical Volatility. Should not the Greeks be determined by Implied Volatility? Comparing the values of the Greeks calculated by this workbook produces values that agree with, e.g., the values at TDAmeritrade or ThinkOrSwim only if the formulas are edited to replace HV with IV.
PeterJanuary 20th, 2011 at 5:40am
Not yet - do you have any examples you can suggest? What pricing model do they use?
rJanuary 20th, 2011 at 5:14am
anything available for interest rate options?
PeterJanuary 19th, 2011 at 8:48pm
It is the expected volatility that the underlying will realize from now until the expiration date.
general questionJanuary 19th, 2011 at 5:13pm
hi, is the historical volatility input annualized vol, or vol for the period from today to expiration date? thanks.
imlakJanuary 19th, 2011 at 4:48am
very good, it solved my proble
SojaTraderJanuary 18th, 2011 at 8:50am
very happy with the spreadsheet
very useful
thanks and regards from Argentina
PeterDecember 19th, 2010 at 9:30pm
Hi Madhuri, do you have Macros enabled? Please see the support page for details.
madhuriDecember 18th, 2010 at 3:27am
dear friend,
same opinion i have about the spread sheet that
"this model doesn't work, no matter what you put in on the basic page for values, it has an invalid name error (#name?) for all the results cells. Even when you first open the thing, the default values the creator put in don't even work"
-madhuri
MDNovember 25th, 2010 at 9:29am
Is these formulas will work for indian market? Please answer
rickNovember 6th, 2010 at 6:23am
Do you have it for US stocks???
egress63November 2nd, 2010 at 7:19am
Excellent stuff. Finally a good site with a simple and easy to use spreadsheet!
Thanks guys! :)
-A gratified MBA Student.
DineshOctober 4th, 2010 at 7:55am
Guys, this works and it is pretty easy. Just enable macros in excel. The way it has been put is very simple and with little understnading of Options any one can use it. Great work specially Option Strategies & Option Page.
PeterJanuary 3rd, 2010 at 5:44am
The shape of the graphs is the same but the values are different.
robertJanuary 2nd, 2010 at 7:05am
All graph in Theta sheet are identic. Are Call Oprion Price graph data correct? thx
daveMJanuary 1st, 2010 at 9:51am
The thing opened immediately for me, works like a charm.!! and the Benninga book..... I am so pleased that you referenced it...
Great Stuff..!!
Thanks so much.
PeterDecember 23rd, 2009 at 4:35pm
Hi Song, do you have the actual formula for Asian options?
SongDecember 18th, 2009 at 10:30pm
Hi Peter,
I need your help about the Asian option pricing using excel vba. I don't know how to write the code.
Please help me.
PeterNovember 12th, 2009 at 6:01pm
Does the spreadsheet not work with OpenOffice?
WonderingNovember 11th, 2009 at 8:09am
Any solutions that will work with OpenOffice?
rknoxApril 24th, 2009 at 10:55am
Very Cool! Very nicely done. You sir, are an artist. One old hacker (76 years old - started on the PDP 8) to another.
PeterApril 6th, 2009 at 7:37am
Hi Ken,
Take a look at the following page:
https://www.optiontradingtips.com/pricing/workbook-support.html
KenApril 6th, 2009 at 5:21am
Hi, What if i am using the Office on Mac? it has an invalid name error (#name?) for all the results cells... thx
giggsApril 5th, 2009 at 12:14pm
Ok, it's working now. I saved & closed the excel file, opened again, and the results were there, in the blue areas! FYI, I had enabled all the macros in "Security of the macros" . Can't wait to play with the file now...
giggsApril 5th, 2009 at 12:06pm
I don't see the popup. I use Excel 2007 under Vista. The presentation is quite different from the previous versions. I enabled all macros. But I still get the #name error. Any idea?
giggsApril 5th, 2009 at 12:00pm
I don't see the popup. I use Excel 2007 under Vista. The presentation is quite different from the previous versions. Any idea?
AdminMarch 23rd, 2009 at 4:17am
Hi Dissapointed,
The spreadsheet requires Macros to be enabled for it to work. Do you see a popup on the toolbar asking you if you want to enable this content? Just click it and select "enable".
Please send me an email if you need further clarification.
disappointedMarch 22nd, 2009 at 4:25pm
this model doesn't work, no matter what you put in on the basic page for values, it has an invalid name error (#name?) for all the results cells. Even when you first open the thing, the default values the creator put in don't even work
Add a Comment