Google Sheets Volatility Calculator
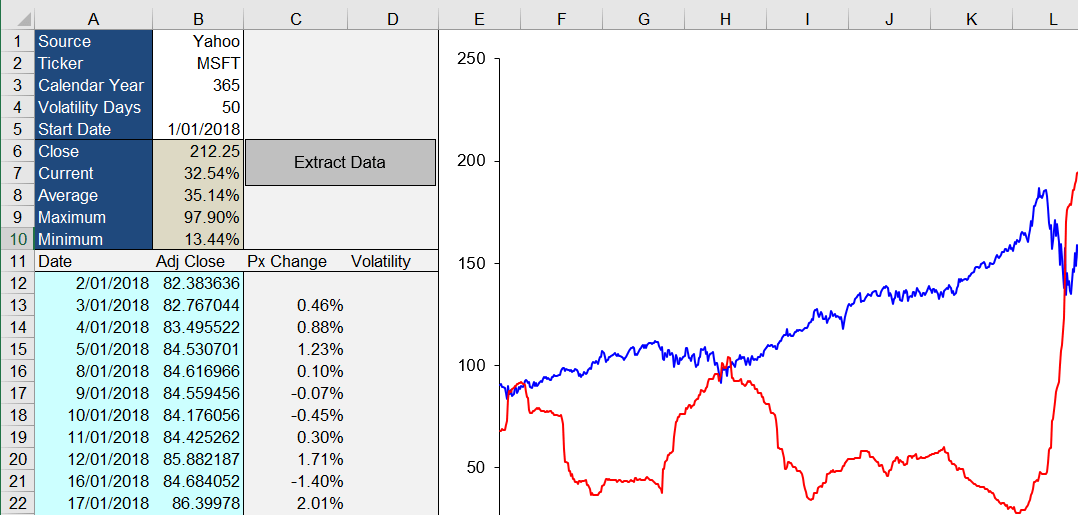
My Google Sheet will give you a stock's realized volatility in seconds
- Free, instant download of up to date stock price history
- Calculates realized volatility for a given symbol
- Customizable price history and volatility length
- Graphs both price vs volatility
- Unlocked and editable
Volatility Calculator
Enter your details and I'll send the workbook straight to your inbox.
What is Volatility?
Volatility is a measurement of uncertainty. You've probably already heard this term in an every day setting where referencing a behavior can be said to be "so volatile". The context may have been an observed behavior that was referenced as being wild and unpredictable.
In finance it's the same concept; the behavior in our case is a stock's price movement where it can be said to be highly volatile if observed to be unstable and unpredictable.
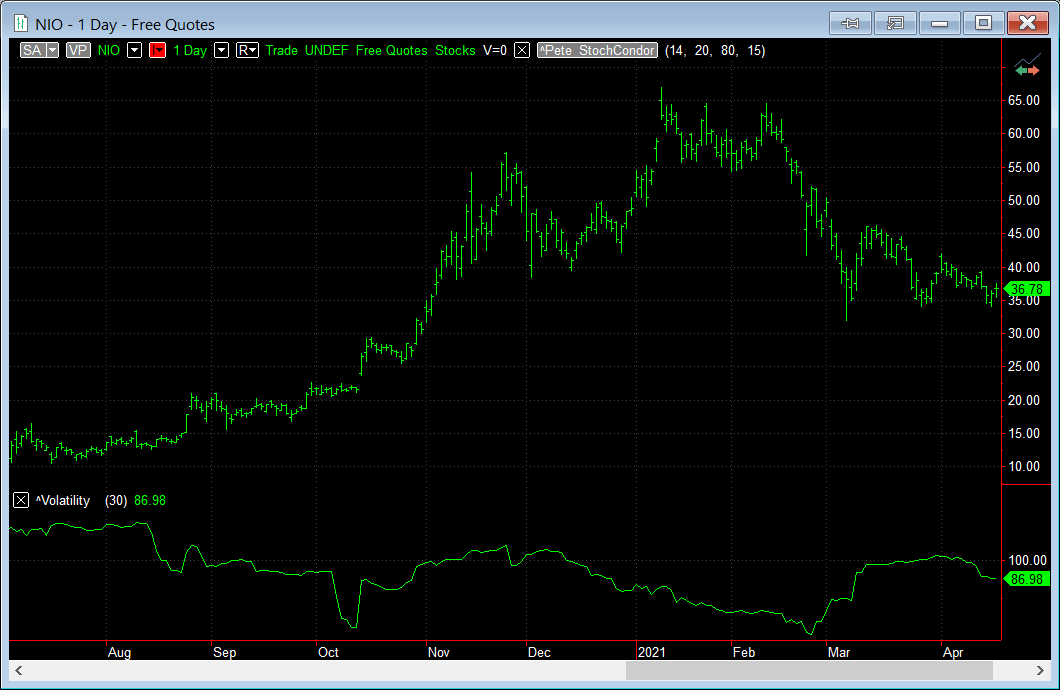
High Volatility
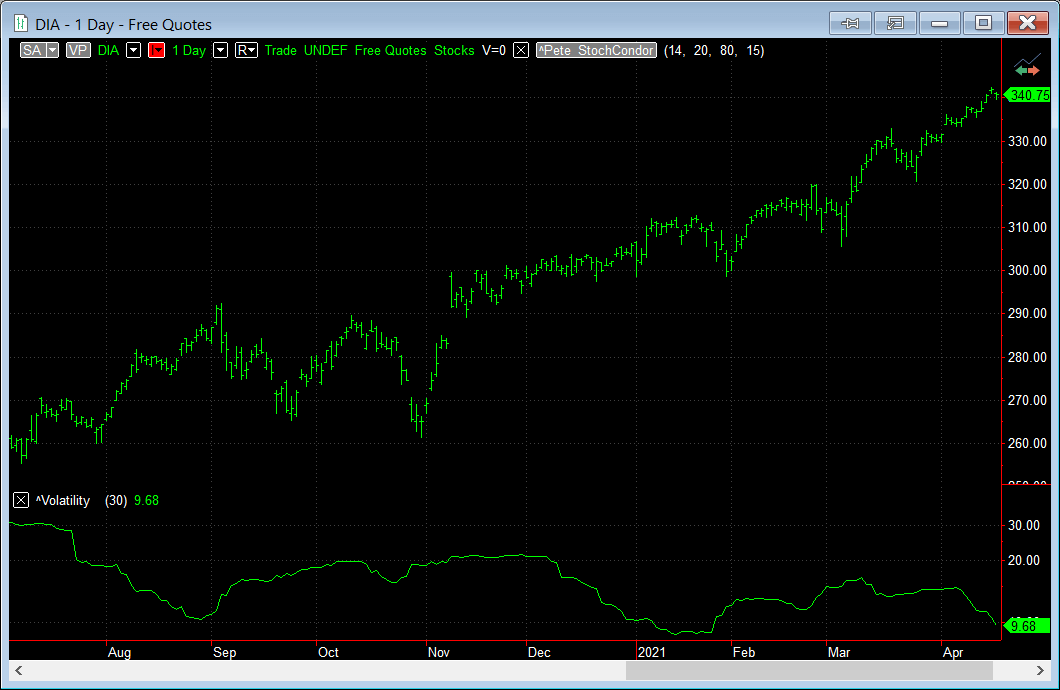
Low Volatility
The above examples show the difference between a stock that is highly volatile and one that exhibits low volatility.
While NIO's current vol is 87% it has spent almost a third of the time seen in the chart at or above 100% volatility. And the price range has gone from $10 to over $65 (+550%) in the same period.
Conversely, take a look at the Dow Jones ETF (DIA) pictured for the same range. It has a current vol of 10%, topping out at 30% but having a price range of $260 to $340 (+31%). This is the type of impact that high volatility makes to stock prices.
Why is Volatility Important to Traders?
Of all the inputs that go into valuing an option contract the two most uncertain factors are the underlying price itself and the volatility of the underlying — or more specifically the volatility that is expected for the underlying from now until the expiration date.
For option traders, volatility means opportunity. When considering the strike price of an out-of-the-money option contract, more volatility means more chances that the option will be profitable by the expiration date. For example, take NIO above. If you didn't have any insight into the volatility implied by the market prices, would you have bought a $50 call option that expires in 4 months with the stock trading at $12? It seems very unlikely to bet on the stock going up by 400% in that time. But when you know that prices are implying a volatility of 150% it makes the opportunity of that move seem more likely.
And because of the increase in likelihood that an option will be profitable, options that are perceived to have more chance of being in-the-money will be more valuable — hence the option premiums will be higher relative to a comparable stock that has low volatility.
Generally, higher volatility = higher option prices.
Implied Volatility vs Historical Volatility
When the volatility of the underlying is expected to increase, the demand for these options increases their prices in the market. The volatility that is derived from the option bid/ask prices is called the implied volatility. Implied volatility is calculated from an option pricing model where instead of generating a theoretical price, the model uses the market price as the input and reverses the calculation to derive the volatility.
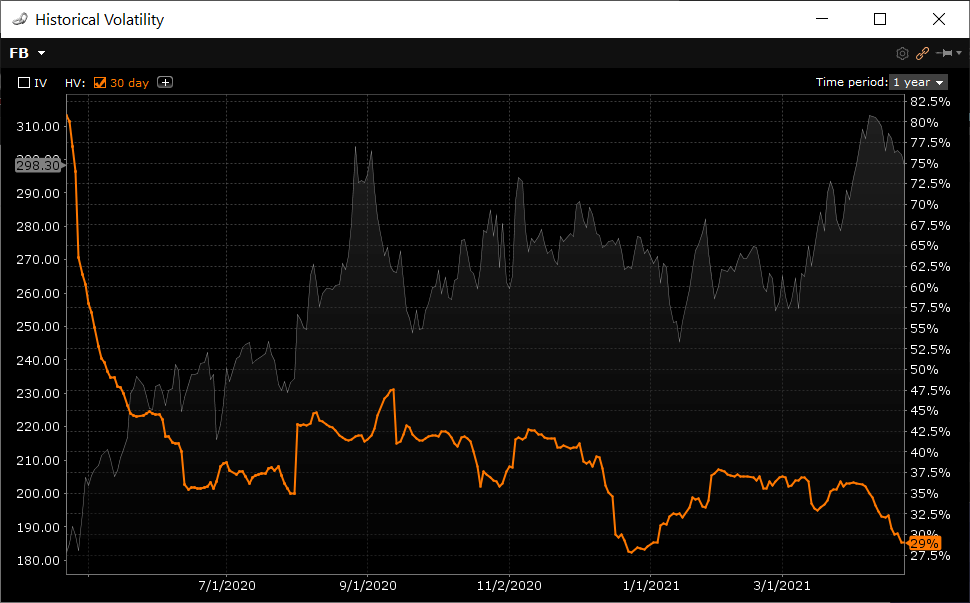
Historical Volatility
Also known as "realized" or "statistical" volatility. Taken from the closing prices of a stock and shows where the stock's volatility currently is. Historical = past volatility.
Implied Volatility
Derived from the market prices of the option contracts. The estimate of where the market believes the stock's realized volatility will be from now until expiration. Download my option workbook for the method. Implied = future volatility.
Can You Profit from Volatility?
You've probably laughed at the old adage of buying low and selling high when being referenced to trading stocks. What is high and low? A stock can't trade lower than zero but it can keep going up and up.
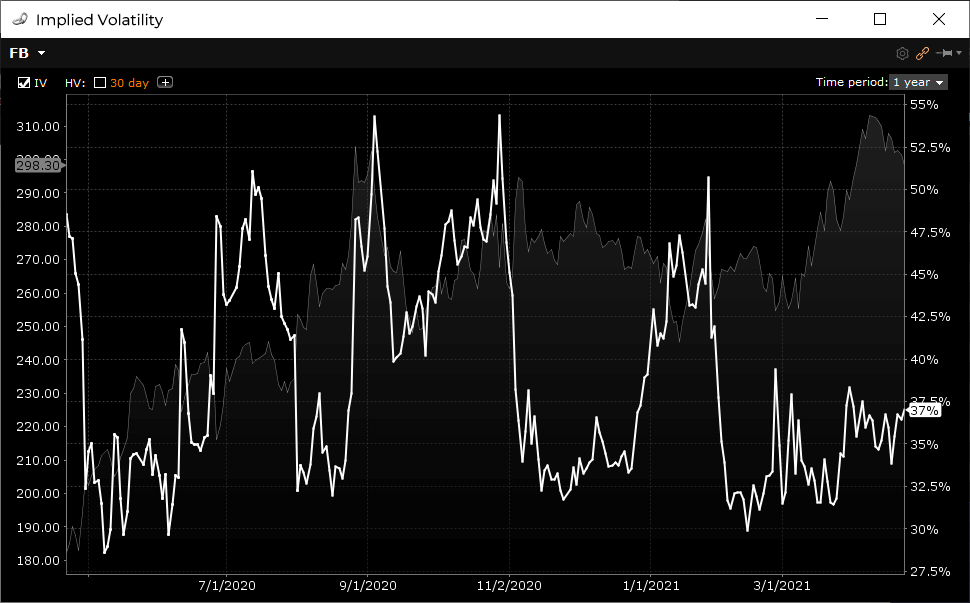
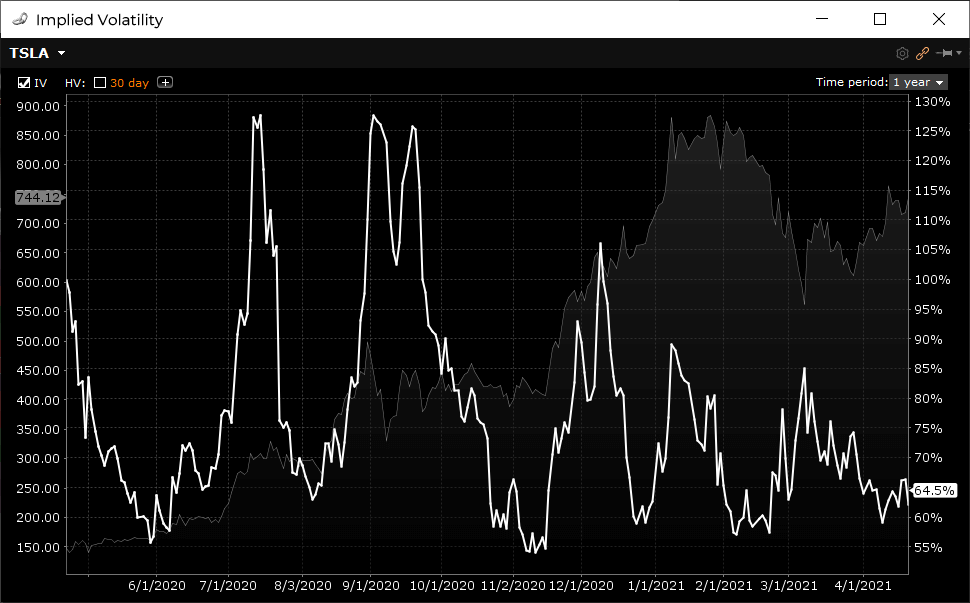
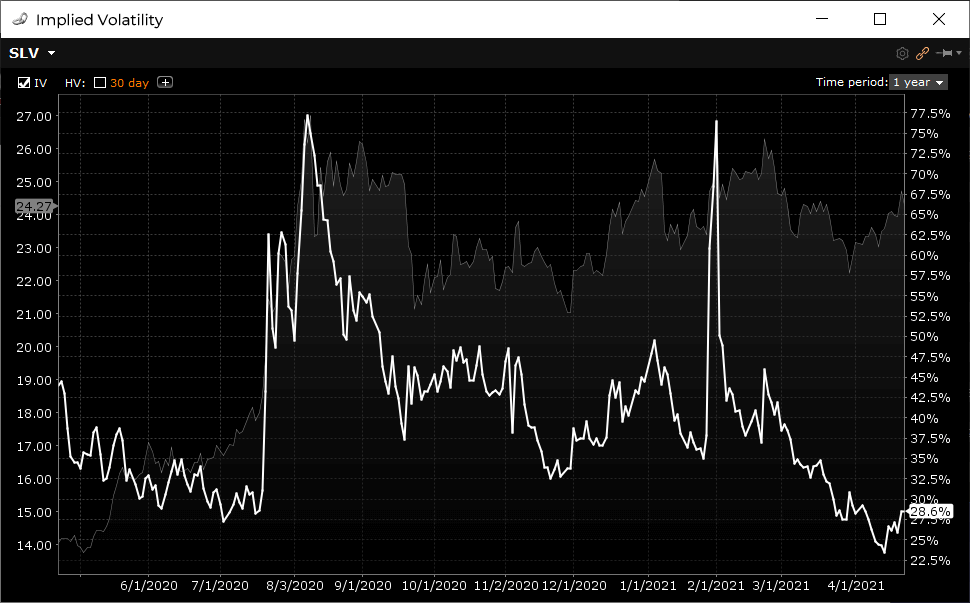
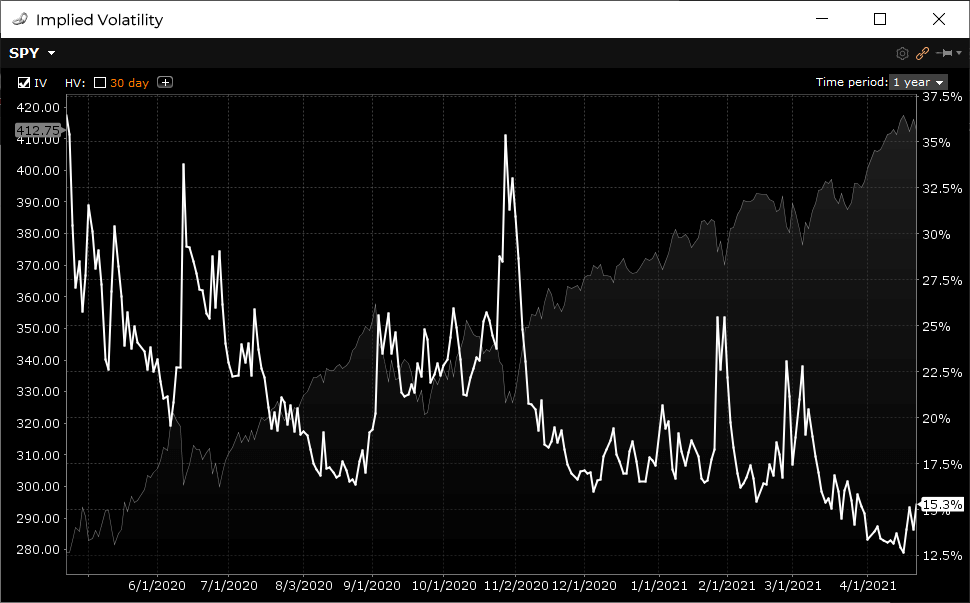
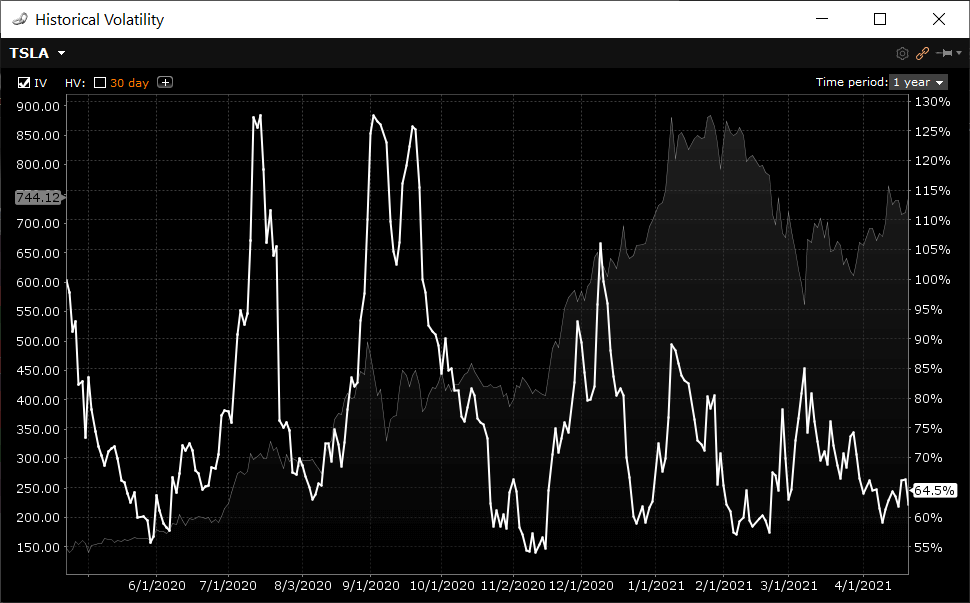
Volatility, however, tends to be a mean reverting asset. Not all of the time, but certainly enough of the time to justify using it in your decision making. Take a look at this selection of implied volatility graphs for stocks, index and commodity ETFs:
AMZN Stock
SLV ETF
SPY ETF
TSLA Stock
I'm not saying that you can predict the direction of volatility at any point in time but the ebbs and flows of the movement tends to revert to an average — more often when volatility spikes. You will often see a huge bump in implied volatility followed by a drop.
These are opportunities many retail traders look for — selling options when volatility is high (expensive) and buying options when volatility is low (cheap).
Earnings Plays and the IV Crush
Macroeconomic events and surprise company announcements are example drivers for increased volatility. But these types of events aren't known ahead of time.
But we do know when publicly traded companies release their earnings results — every quarter of every year.
Every 3 months the top companies go through periods of increased volatility in the lead up to their earnings announcements. Company results aren't fully known until publicly released, which in itself creates uncertainty. As unexpected results can cause massive price swings, option traders try and anticipate post earnings stock price movements, which drives up the prices (and hence implied volatility) of the options that expire after those earnings results.
The first thing new option traders think of when it comes to earnings plays are long straddles. That is, buying a call and a put at the same strike price, which creates an each way bet on the stock so that if it does move wildly in one direction you'll be covered either way. This isn't a bad idea in itself but straddles come at a cost as you're buying the options. This means that the stock has to move more than the strike price plus the total premium you've paid. So, straddles are most effective when prices and volatility are low.
If volatility IS indeed low pre-earnings, then yes, long option strategies make sense. However, what you'll notice is that most stocks experience increasing levels of volatility in the lead up to their earnings release. This volatility greatly inflates the option prices making strategies such as straddles much less attractive — the more you have to pay increases your breakeven points and the amount the stock has to travel before you start making any money.
The IV Crush
Take a look at this graph, which will help me explain what an IV Crush is:
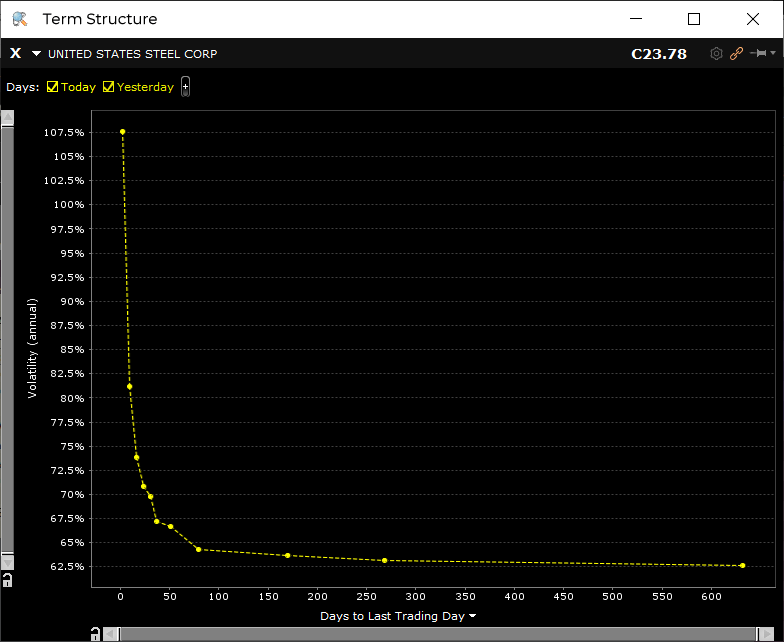
This is the at-the-money term structure for United States Steel (X). It plots the ATM volatility at each option expiration. This graph is telling you where the market believes volatility will be at each of the dates along the x-axis. Notice the massive spike 2 days out?
This spike is because United Steel are releasing their quarterly earnings numbers tomorrow after market. After the numbers are out and all the relevant information is now with the market, volatility is expected to drop in the following expirations. This drop in volatility is what traders refer to as IV crush (implied volatility crush).
Option traders look to take advantage of the vol crush by using short option strategies prior to the announcement and then looking to exit or buy back the options immediately after the earnings are out. These strategies are most effective when the stock price movement post earnings is less than the expected move as indicated by the implied volatility.
The two most common market neutral earnings plays are Short Iron Condor and Long Double Calendar spreads. Both are market neutral — meaning you're not biased in either direction regarding price movement. But both require the underlying stock to stay within the upper bounds of the strike selection.
If the earnings numbers are a huge surprise to the market then these levels will be tested and could result in the strategy hitting its maximum threshold in one move. I'm a bit cautious these days playing earnings due to the lottery style of trading it is — one day you're in the middle of a condor range and the next morning you're outside the long strike with little opportunity to adjust.
Iron Condors and Double Calendars are a key strategy used in the Trading as a Business course found on this site. If you'd like to know more, send me an email and start a conversation.
57 Comments
Rob December 12th, 2017 at 10:05am
The Excel Historical Volatility worksheet seems to have stopped working. It is giving "Error! Symbol not found."
Thank you if you are able to fix it.
Peter November 28th, 2017 at 8:18pm
Hi Pratik,
It works with whatever symbols Google provide for download via CSV. When you lookup a symbol in Google Finance and then click Historical Data, look for an Excel CSV icon to the right. If that is there then it will be able to be downloaded via the spreadsheet.
Google may add new markets symbols to their available list of downloads but at this stage it looks like only US symbols are supported.
You are welcome to copy/paste any data into the sheet and just re-use the formulas shown to suit. The Visual Basic code is also unlocked so you can modify that to suit another data source if you're good with VBA.
Pratik November 27th, 2017 at 1:00pm
Works with US market listed symbols only? What to do if I want to look up and use symbol on Indian stock maret like NSE. Lets say I want to look up NIFTY index or Infosys on Indian market NSE.
How to import that data?
Peter September 25th, 2017 at 8:26pm
Hi Melanie,
Yes, there was a change in the format of data provided by Google. A fix was made yesterday. If you download the file again it should work correctly. Let me know if you still have problems.
Melanie September 25th, 2017 at 5:23pm
I am only able to get one year looking back worth of data from the day, even if i put the start date much earlier such as 2015. is anyone else having this problem? how do i fix.
Peter September 12th, 2017 at 11:31am
Hi Kristine,
Yes, since Yahoo! removed support for the historical data many instruments are no longer available for download. Google's API doesn't provide as many symbols as Yahoo! Until I find another provider that supports all exchanges for free, I'm not sure what else you can do. Sorry about that!
Kristine September 11th, 2017 at 12:16pm
Greetings,
I have been using your Black Sholes calculator for years, however I haven't needed it for about 6 months.
I was surprised that it no longer works. I tried downloading the new one and using my code CVE:NCI, however I still get the message "Error Symbol not found" when I Extract Data.
Please help. This is an invaluable too for a small business like mine.
Peter July 17th, 2017 at 6:08am
Hi Rob,
Thanks for pointing it out! Someone else has reported it recently also. Not sure how to resolve this...I'll take a look soon though. Anyone with VBA skills that wants to take a look is more than welcome ;-)
Rob July 14th, 2017 at 9:56am
Thank you for updating the spreadsheet, it is an amazingly useful tool.
Unfortunately, the update introduced a bug thanks to the way Google handles lightly traded stocks. If you use the symbol "ROSE" from 1/1/17 you will see the problem with the data Google sends back. On days with no trading the data reads "30-Jan-17,-,-,-,10.45,0" The "-" seems to trip-up your calculations.
I am not sure if this fix is easy or not, but it would be greatly appreciated.
Thanks
Peter June 19th, 2017 at 1:23am
Hi Lakru,
When using Google, not all instruments are supported via their CSV download option. When checking a symbol on Google, go to Historical Prices and on the right hand side check for a Download CSV option...if it is not there, then the spreadsheet won't work. I know that currently, HK stocks aren't on provided via CSV. However, I noticed that ETFs weren't provided a couple of months ago but have since been added...so maybe it is a matter of time until they are added...
Add a Comment