Payoff x Probability
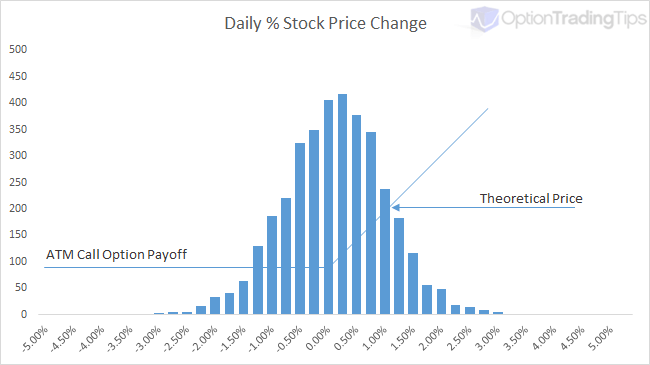
In the above graph of this concept, the vertical bars simulate the daily price changes of a stock over 10 years (with a mean of 0 and standard deviation of 1). The blue line represents the payoff value of a call option at its' expiration date.
The most likely set of price changes occurs around the ATM point and hence ATM options have a delta of 0.50; at this point there is a 50% chance of the stock being above this point by the time the option expires. If the stock has a higher distribution of daily returns (higher volatility) then it is more likely that the option will expire ITM and hence have a higher valuation. Conversely, if the stock's price changes are limited to a narrow trading range (low volatility) then the option price will be lower as there is less likely hood that the stock will jump and expire above the call option's strike price.
Option pricing models are valuation tools that attempt to numerically describe the above graph and output a valuation price for the option in today's terms.
Why Use a Pricing Model?
Generating a single theoretical price is great, especially useful for those looking to value employee stock options. However, a wider usage of pricing call and put options can be found in creating scenarios for option strategy evaluation, calculating implied volatilities from market prices, creating volatility curves, out putting option Greek risk estimations etc.
PnL Analysis
Pricing tools such as my Option Trading Workbook, allows users to enter call, put and stock combinations to form various option strategies. The calculations then enable option strategy evaluation by showing the total scenario payoff at the expiration date as well as the strategy theoretical price. Graphing a combination in this way allows you to view how your profit and loss may change as the price of the underlying stock or stock volatility changes.
Take this as an example. This graph is an option strategy called an Iron Condor. The blue line shows the profit/loss of the strategy at the expiration date depending on underlying stock price. However, the pink line shows the theoretical profit/loss of the condor calculated at today's date. It uses inputs to derive an approximate price for the legs of the options, combines them into the strategy and shows you the curve of your P&L versus the underlying stock price.
Using price modelling in this way helps option traders assess the risks associated with a position before placing the their trades.
Implied Volatility Analysis
If an option contract already has a price i.e there is a bid or ask price in the market, you can use these values into a pricing model to calculate what the volatility input would be assuming all other inputs remain the same. This volatility number is called the implied volatility.
Implied volatility is arguably the most important of all the pricing factors when it comes to option trading. It effectively tells you what volatility the stock will be need to experience if it reaches the strike price by the expiration date. Implied volatility is not flat across the strike range for an expiration date; as an underlying moves higher and lower during a certain time frame, its' underlying volatility must also change as a result.
If you don't have Excel, I have built an online version of this implied volatility calculator.
Risk Estimation (The Greeks)
Because option contracts have a finite life span, their price movements aren't linear like stock or futures prices are. Factors such as underlying price, time to expiry, volatility and interest rates all play a part in influencing the movement of the option contract. Option Greeks are outputs to theoretical pricing models that help traders estimate how these inputs are likely to effect the price of the option. Read more about option greeks.
Types of Models
Due to the complexity of option contracts and the assumptions made in estimating underlying asset prices, there are many different pricing models to choose from. The types of models are built using either Analytical methods (given by closed formulas), and numerical routines (also called finite difference methods). The choice of model can depend on factors such as the option type (vanilla, binary, knock in/out etc) asset type (future, stock, index), option exercise style (American, European) or volatility assumption (normal, log normal, binomial).
Note, most of the option contracts traded by the average retail trader (stock/index/ETFs) are called Vanilla Options, which narrows down the type of model used. Broadly, vanilla options will use either Black and Scholes or a Binomial model for theoretical pricing.
Analytical models are computationally cheap i.e they are fast and effecient at calculating as the result is provided by a closed formula. Numerical models on the other hand are typically more expensive on time and processing as they will use and iterative routine to solve for the option price. I.e. A numerical pricing model such as the binomial model will break down (or iterates) the stock price movement into x number of potentials "steps" where each step is assigned a probability of the stock going up or down according to the volatility and time to expiration. At the end of this tree, all of the possible stock prices are then compared to the strikes at the expiration date. You can read more about this iterative approach here.
Examples of Analytical models:
- Black & Scholes (default for European options)
- Computationally cheap. Not suited for dividend paying stocks.
- Black -76
- Bjerksund
- Barone-Adesi
- Geske
- Kim
- Euro option
Examples of Numerical models:
- Binomial (default for American options)
- Binomial (relative)
- Cox-Ross-Rubenstein
- Tri-nomial
The above example models have been taken from the book The Complete Guide to Option Pricing Formulas by Espen Gaarder Haug. If you would like to see the formulas used for these, feel free to buy his book - it comes with a CD containing spreadsheet examples of many different option models.
Inputs into a Pricing Model
Pricing models require a number of inputs in order to generate a fair value. They are:
- Underlying Price
- The current base price of the stock/future instrument
- Exercise Price
- The strike price of the option being calculated
- Time to Expiration
- The time until the option expires, generally expressed as a decimal per year i.e. 0.25 for a 3 month option
- Volatility
- The expected volatility of the underlying asset, expressed in terms of annual volatility. For an estimate, you can try my historical volatility calculator
- Interest Rates
- The current underlying interest rate, or borrow rate
- Dividends
- Depending on the model, either discrete dividends or a dividend yield is used here
Resources
Historical Volatility Calculator
Hoadley's Strategy Evaluation Tool
Implied Volatility Calculator
PeterAugust 6th, 2018 at 11:19pm
Hi Rajeev,
Unfortunately, the option scanner only works for US options.
Rajeev SinghAugust 6th, 2018 at 3:14am
The scanner works for US stocks only or it can be setup for indian FnO stocks options also.
PeterJuly 6th, 2017 at 9:20pm
Hi Nirav,
Option contracts are "derivatives"; their value is derived from another (called underlying) contract. So, the pricing models mentioned above are collectively called derivative pricing models.
NiravJuly 6th, 2017 at 6:40pm
What is a derivative pricing model? How would it differ to the ones you have mentioned above?
PeterApril 27th, 2016 at 8:02pm
Hi,
I think we're confusing "price" and "premium" here.
The price of the option is what you would see on the screen and is what is referenced against the stock and strike price. Premium is total cash paid or received, which is determined by both the multiplier and number of contracts traded.
In your second paragraph you mention that "premium paid is 0,4", however, in your suggested answer underneath you say "p=0.04", which must be the price of the option.
If the premium paid = 0.40 and the price = 0.04 then the multiplier must be 10? I don't have that information, so I am assuming from your input here.
0.04 seems reasonable to be the price of the option. 0.40 would be unlikely to be the "price" as it is almost double the value of the strike price.
anonymousApril 27th, 2016 at 9:45am
Hi Peter
Are you saying that I should use 40 cents=0.40 and not 0,04
so that means my whole answer is incorrect , so confused
PeterApril 27th, 2016 at 8:06am
Hi,
I'm not sure of the placing of the decimals for the premium, but going from your first answer below i.e premium = 0.04 then I would answer as follows:
For a put option the net payoff is max(0,(strike - spot)) - premium. So,
1) -0.04 (option is worthless, loss is premium)
2) -0.04 (option is worthless, loss is premium)
3) -0.03 (+0.01 in-the-money, after deducting premium loss -0.039)
4) Breakeven at a spot of 0.15
Let me know if you disagree.
AnonymousApril 27th, 2016 at 7:07am
Dear Peter
I am struggling with this question would you mine advising if it is correct
A put option allows the holder to sell NOK250 000.00 at an exercise exchange rate of 0.190(AUD/NOK).if the premium paid is 0,4 AUD cents for each NOK, calculate the net payoff at the following spot exchange rates
i.0.200
2.0,192
3.0.180
4.At what exchange rate will the holder break even?
i.s=0.20 x=0.190 p=0.04 =0.20+0.04=0.24-0.19=-.005 loss do not exercise
2.=0.192 x=0.190 p=0.04=0.192+0.04=0.232-0.19=-.0.042 loss do not exercise
3.0.180 x=0.190 p=0.04=0.18+0.04=0.24-0.22=-.003 loss do not exercise
4. 0.190-0.04=0.15
PeterApril 13th, 2016 at 2:07am
Hi Mananabrl,
The prices quoted are in AUD and 5 cents is represented as 0.05.
The net payoff of a call option is the maximum of either 0 or (spot - strike) less the premium paid. Therefore:
1) (1.7240 - 1.6500) = 0.074
2) (1.8150 - 1.6500) = 0.165
3) (0 - 0.0500) = -0.0500
4) (1.6000 + 0.0500) = 1.65
MananabrlApril 13th, 2016 at 12:30am
Hi Peter
I am struggling to answer this,please help
A call option allows the holder to buy USD200 000 at an exercise exchange rate of 1.6000 (AUD/USD). If the premium paid is 5 Australian cents for each USD, calculate the net payoff at the following spot exchange rate:
1)1.7240
2)1.8150
3)1.5365
4)At what exchange rate will the holder break even?
PeterOctober 15th, 2014 at 4:48pm
Hi Joseph,
The option pricing spreadsheet is for European options and uses the Black and Scholes model.
For American options you would use the Binomial Model - there are some Excel examples on that page.
Joseph RosenbergOctober 15th, 2014 at 11:38am
Your model doesn't say whether it is valuing European or Amercian style stock options. I assume that it is American style (can exercise any time up to the maturity date). Please confirm if so. Thanks,
Joe Rosenberg
PeterJune 10th, 2014 at 1:01am
Hi Sam,
Yes, I think using the index to judge overall market volatility is a sound approach!
What option models are you using? Are you using Excel for your tests?
samJune 8th, 2014 at 10:48pm
for my thesis i have to test 5 option pricing models wrt the indian market. i want to evaluate this for options on stocks over two periods one volatile and one relatively stable. is it sufficient if i plot the index values and identify the periods or is there any other method to do so? Also wrt volatility how to calibrate it for my models?
PeterMarch 31st, 2014 at 6:43pm
Hi,
1. Alot of the FX spot option market is over the counter (OTC) so it will be difficult for a retail trader to obtain live prices. However, there are retail trading firms that claim to support FX options such as Interactive Brokers, FXCM, CMC FOREX and Saxobank.
I use Interactive Brokers and just tried loading an option chain on USD.AUD but the application reported no options listed for that underlying. The live chat is closed for technical reasons so I am unable to ask right now.
Alternatively, if you want to look at options on FX Futures you can do that at the CME website. Most retail brokers should have no trouble supporting these instruments.
2. As the underlying for FX options is a currency pair, you may want to understand the factors affecting both legs that make up the underlying price - the spot price. Also, because the spot price is affected by two currencies, two opposing interest rates are also at work. Here is a slide deck from the ISE exchange that goes through the mechanics of FX Option pricing in more detail;
FX Option Pricing - by Steve Meizinger
3. Yes, I would agree that is a good the general conclusion.
Trainer RCMarch 27th, 2014 at 8:32am
Hi
I have some questions on FX options,
1. Where is a good place to see real time data of an FX option? in terms of prices.
2. In a real world scenario, where FX option values are calculated daily, what's the best way to explain the price movements? for example if a USD EUR call options value increases, whats the starting point to explain this movement? which attributes should I consider?
3.In an FX option, can I make a general conclusion that the main driver for movements in value is the FX movement? in other words, the current price of the underlying?
Thanks for your time
PeterJune 27th, 2013 at 8:26am
Hi Raihaan,
I'm not sure there is enough information to answer the question properly. It sounds like a 1.8000 strike call option versus a 1.8040 spot price, which would mean a loss at expiration of 0.0040. Then you have to subtract the premium, which seems very large at 0.5000. If that is the case then the total loss would be 0.4960.
Also, you'd need to multiply this total loss by the multiplier of the option. Is the multiplier 100,000?
Did you grab this question from a test somewhere?
RaihaanJune 26th, 2013 at 8:08am
A call option allows the holder to buy USD100 000 at an exercise exchange rate of 1.8000 (AUD/USD). If the premium paid is 0.5 Australian cents for each USD, calculate the net payoff at the following spot exchange rate:
1.8040.
How would i go about doing this?
LeoApril 20th, 2013 at 1:37pm
I sold a put at a 175 strike. On expiration day the stock was trading above 175 by a few cents and below 175 by a few cents. I bought a call to close out the trade before the market closed. The stock closed the day at 174.95. If I had not closed the trade would I have been put the stock trading that close to the strike price. How close to the strike price can the sold put expire worthless.
PeterMarch 2nd, 2013 at 3:14am
Hi Peter C,
No additional capital is required in this case as you are just unwinding or closing out an existing position.
Currently you are long 2 contracts and after selling 2 contracts your position will be zero.
You would only need to be concerned about capital if your sold short the 2 contracts.
Peter CMarch 1st, 2013 at 5:52pm
Peter, I have another question. I purchased 2 bidu 95 strike Apr13 call @ $2.80. Let's say toward the end of March, bidu is trading @ $100. Now, I'd like to sell the 2 95 strike call. Do I need to have 200 shares of bidu in my account in case someone bought my options and decided to exercise them?
Thanks again.
PeterFebruary 28th, 2013 at 9:39pm
Hi Peter C,
The options all have different expiration dates.
Have a look at the Symbol - the numbers after the ticker but before the letter C (for call option) indicate the expiration date. E.g. BIDU130301C00090000 is the $90 call expiring on the 1st March.
There are five expirations in March for BIDU; 1st, 8th, 16th, 22nd and 28th.
Peter CFebruary 28th, 2013 at 3:36pm
Hi Peter, I have a question regarding the call prices. I'm currently looking at bidu 90 strike Mar13 call on yahoo finance site. There are 5 different asking prices. The asking prices range from $1.14 to $3.70. Are these prices set by 5 different writers? Wouldn't it make sense to purchase the 90 strike Mar13 call at $1.14 than at $3.70, am I missing something?
Also, I'd like to confirm an expiration date. The Mar13 call price expires on the third Friday and the Mar13 week 4 call expires on the last Friday of the month, correct?
Thanks.
PeterAugust 29th, 2012 at 7:56pm
Hi Kanchan,
When the market price of the option is higher than what you have calculated then this means that the volatility implied by the market is higher than what you have used in your calculator.
The volatility input used to calculate a theoretical price is an estimate of the future volatility that the underlying asset is expected to experience during the life of the option. The volatility implied by the market price tells you where the market thinks volatility will trade over the life of the option.
If you strongly disagree with the market price of the option given this difference in volatility then you will be able to say that the option in market is "expensive".
What you do then is up to you ;-)
kanchanAugust 27th, 2012 at 5:02am
hi!
i calculated the price of an option using an option calculator .. it showed the price as 72 .. the market price of the option is 34 at present .. wat does this imply ? and wat can be done ??
PeterMarch 27th, 2012 at 3:11am
Hi Terry,
It depends on your trading style I suppose - but for most retail traders real-time theoretical prices are a bit excessive. You can price the options in Excel without real-time prices to gain an estimate as to where it should be trading.
TerryMarch 27th, 2012 at 2:25am
Hi Peter,
Thanks alot for your reply. I have one more question, please. In case of options with very low liquidity, do we need to refer to real-time Theoretical Price?
Regards,
PeterMarch 26th, 2012 at 7:38pm
Hi Terry,
No, as a retail trader you won't need real time updating theoretical prices. High volume traders and option market makers are the types of traders needing to watch option prices that closely.
TerryMarch 15th, 2012 at 1:19am
Hi Peter,
I have one question regarding Theoretical Price. Suppose we are Option Traders, do you think real-time updated Theoretical Price is not necessary if we trade very high liquidity options? In other words, only once a day update Theoretical Price is good enough to refer to the trading?
Thanks.
Regards,
PeterJanuary 16th, 2012 at 4:30pm
Please see the page on calculating volatility.
AmanJanuary 16th, 2012 at 12:37pm
The spreadsheet ask for the "historical volatility" for one of my inputs. How can I determine/calculate the historical volatility? Thanks.
kDecember 17th, 2011 at 7:36am
thank u peter ..
could u tell me what one can do wen an option is under priced or over price ? should we buy it or should we sell what we have or hold the position ...
PeterDecember 14th, 2011 at 4:16pm
Hi K, apologies for the delay - I missed your first comment.
An overpriced or underpriced option occurs when you have used an option pricing model to calculate a theoretical price given certain inputs to the model e.g. stock price, interest rates, dividends, strike price, expiration date and volatility.
Out of the above inputs all are known except the volatility, so when the market price of an option is higher than what has been calculated by an option model, this means that the market is "implying" a higher expected volatility for the underlying stock from the current point until the expiration date.
If the market price of the option is lower than the theoretical price then the market is implying a lower expected underlying volatility.
kDecember 14th, 2011 at 8:25am
hi peter,
how do we know that an option is overpriced or under priced ? n what implication does it have ?
TiburonDecember 3rd, 2011 at 9:20am
Good work Peter.....Keep it up!! You are a great help to beginners.
kDecember 3rd, 2011 at 12:59am
hi peter,
how do we know that an option is overpriced or under priced ? n what implication does it have ?
PeterNovember 27th, 2011 at 5:32pm
Hi Omkar,
Please see my option pricing spreadsheet.
Omkar KulkarniNovember 26th, 2011 at 3:06am
Hello Peter
Kindly provide me excel format for better understanding & study.
regards
catfishNovember 3rd, 2011 at 7:24am
Thanks Peter! Perfect; thanks for the clear explanation!
PeterNovember 2nd, 2011 at 5:03pm
Hi Catfish,
Adj Close is the closing price adjusted for dividends and stock splits.
Px Change is the daily percentage change.
The Volatility column measures a range of Px Changes according to the cell B3. So the cells are blank until enough data is available to calculate.
The values directly below the input cells are;
Close = Current closing price of the stock.
Current = Current historical volatility value.
Average = Average of the historical volatility for the data set.
Maximum = Maximum volatility for the period.
Minimum = Minimum volatility for the period.
catfishNovember 1st, 2011 at 7:22pm
Hi Peter. Can you explain the output columns in the historical volatility spread sheet? I don't understand the "Adj Close, Px Change", or why the "Volatility" doesn't have ranges for a top portion of that column and what those %'s mean per line?
Finally, I don't understand the %'s which populate directly below the input data?
Thanks in advance!
PeterOctober 10th, 2011 at 7:21pm
Hi Roshan,
1. Risk-free rate is the interest rate i.e. the rate that it costs you if you borrow money to invest.
2. Dividend Yield is the annual rate of return on the stock that is derived from dividends received.
For the NIFTY I'm not sure as it is an index and the Dividend Yield for an index will be the sum of the weighted dividend yields of each component that makes up the index.
You could ask your local broker in India what this is - he could then check on Bloomberg.
ROSHANOctober 10th, 2011 at 4:14am
Hi Peter.i am very new to options.I learn't a lot from this platform. Thank you.
now coming to some of my doubts.
what are the fields.
1. Risk free rate.
2. Dividend yield.
in Black Scholes model.
Please elaborate their significance.
What shall i enter into these fields while the underlying is nifty
Thanks in Advance
GordonOctober 9th, 2011 at 5:45am
Great explanation!
And the excel file is very wonderful!
Thank you very much!
MacSeptember 19th, 2011 at 1:11pm
Great Explanation !! Thanks :-)
sandyAugust 29th, 2011 at 12:02pm
Good explanation.
Debraj BoseJune 17th, 2011 at 11:59pm
Great explanation. Very very thanks to describe it in a simple way.
SMay 12th, 2011 at 7:45pm
Brilliant...absolutely brilliant! Thanks so much... this has formed a solid foundation for tougher concepts!
Dee LaJanuary 23rd, 2011 at 9:35pm
Hi guys, I trade forex digital options.
PeterJanuary 13th, 2011 at 4:20pm
Hi Deva, check out the page on the Black Scholes Model and let me know if you have any questions.
devaJanuary 12th, 2011 at 11:46pm
hi my dear friends i want know about option pricing models please help me...
PeterMay 28th, 2010 at 7:19am
What do you mean by manually? You can check the code that I use for the spreadsheet in the VBA editor. Alternatively, you can review the Black and Scholes formula here;
optiontradingtips.com/pricing/black-and-scholes.html
Let me know if I misunderstood you.
MadhukarMay 26th, 2010 at 4:40pm
22.50 Strike Price
25.00 Underlying Price
26-May-10 Today's Date
30.00% Historical Volatility
20-Jun-10 Expiry Date
3.50% Risk Free Rate
2.00% Dividend Yield
25 DTE
0.07 DTE in Years
If I have to calculate the Theoretical price Manually without using the excel formula how do I do it, i.e. what gets multiplied by what and what get deducted to get a value that excel shows of 2.59. Please send a reply to this message. (note: I have taken this data from Options trading workbook)
PeterNovember 16th, 2009 at 4:04am
Hi Sam, not sure exactly what you're asking but the expected return of the underlying at each maturity is e^(rt), where r = risk free rate - dividend yield and t = time to maturity in years.
So, you would need to calculate this twice I guess.
SamNovember 14th, 2009 at 5:23am
Dear Sir,
How can the expected return on the underlying asset be calculated using derivatives with different maturities?
Thanx
AdminMarch 23rd, 2009 at 4:21am
Hi Will, that's impossible to answer actually. The decay of an option is not linear and cannot be simplified like that. Not only does it depend on the "in-the-moneyness" like you mentioned but also on the volatility, interest rates and dividends.
What exam is this question from? Can you please send it to me?
willMarch 22nd, 2009 at 11:57pm
as an option reaches maturity does the option premium havle or quarter in price?....i know it depends on whether the option is at the money etc.
However it is a question in an exam and no other details are given...thanks
AdminMarch 22nd, 2009 at 6:39am
Yes that's correct. You will notice that in-the-money options have higher premiums than out-of-the-money options.
RogerMarch 19th, 2009 at 9:21pm
Is it accurate to assume that the higher the probability of stock trading above strike price, the more premium an option buyer would need to pay and vice versa if the probability is lower?
AdminDecember 8th, 2008 at 3:17am
Hi Sanjib,
Not sure why the calculator isn't working for you. What do you see in the cells? Perhaps you don't have Macros enabled?
You can try http://www.bankrate.com/ for interest rate information.
sanjib sinhaNovember 27th, 2008 at 11:34pm
sir,
how to operate the the calculator & how can i get get interest of index
AdminAugust 1st, 2008 at 6:37pm
Hi Deepesh,
That is the idea behind an option pricing model; to calculate the premium. I.e. the premium is the result of the calculation.
DeepeshJuly 31st, 2008 at 11:49am
the formula given above is wrong. Payoff should also take premium in account
Add a Comment