Definition of Option Vega
The Vega of an option indicates how much, theoretically at least, the price of the option will change as the volatility of the underlying asset changes.
Vega is quoted to show the theoretical price change of the option for every 1 percentage point change in volatility. For example, if the theoretical price is 2.5 and the Vega is showing 0.25, then if the volatility moves from 20% to 21% the theoretical price will increase to 2.75.
Like Gamma, Vega is the same for both call and put options.
Vega Graphs - When is Vega Highest?
Like all other option Greeks, Vega isn't linear; it changes constantly as all other inputs to the pricing of options change. Some factors have a greater impact on the pricing of options than others. Below you'll find illustrations of the various affects these factors can have on the Vega values of options.
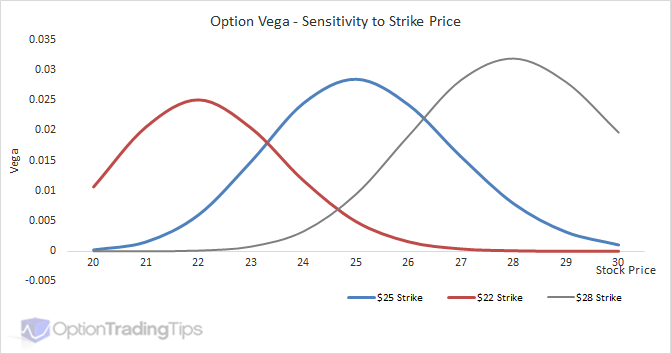
Vs Strike
ATM options are most sensitive to changes in volatility and therefore have the highest Vega values. Vega then tapers off towards OTM and ITM option strikes.
Vs Time
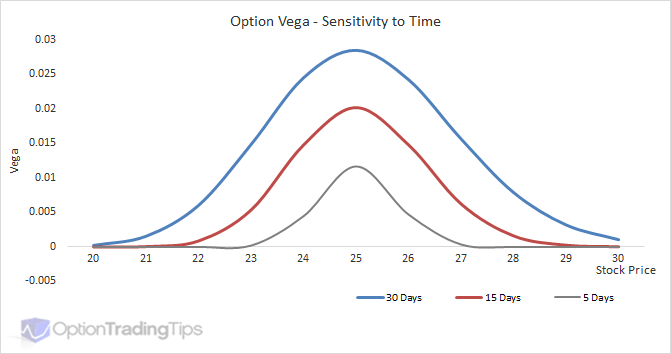
Volatility and time are basically the same thing when it comes to option valuation. Adding more volatility to an option is the equivalent of adding more time; that is, it increases the value of the option. The reason is that increasing either of these elements increases the likelihood of the option being in-the-money by the expiration date.
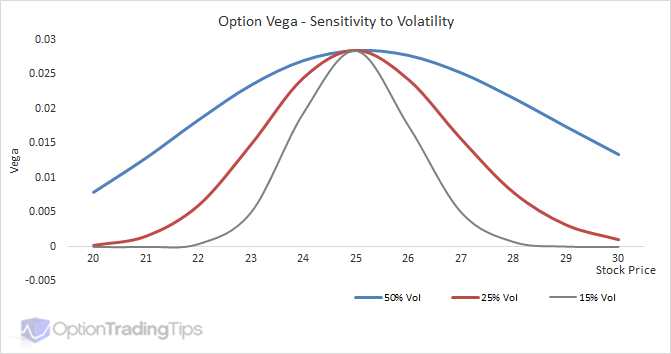
Vs Volatility
Long and Short Vega Positions
Vega has the same value for calls and puts and its' value is a positive number. That means when you buy an option, whether call or put, you have a positive Vega. This is also called being long Vega.
As Vega is effected by volatility, a long Vega position means you want the volatility to rise. When volatility rises, it will increase the value of the option by the Vega amount for every 1 % point move in the volatility. As you are long the option, the increase in the value means an increase in profit.
Conversely, short Vega positions expect volatility to fall in order to profit from a decline in option premiums.
Vega Option Chain
While theoretically the Vega is highest for ATM strikes, in practice this doesn't always happen. In the above Vega vs Strike graph, all other factors in the pricing of the option remain constant, except the strike price. I.e. The volatility input used for the pricing model is the same regardless of whether the option is ITM, ATM or OTM.
In reality, however, the implied volatility as determined by the market prices of the options are not constant; they vary across the strike range and form what's known as the Volatility Skew.
Because the volatility input is different, this can sometimes mean that the strike with the highest Vega isn't always smack on the ATM strike price. Take a look at this option chain of Amazon stock (AMZN).
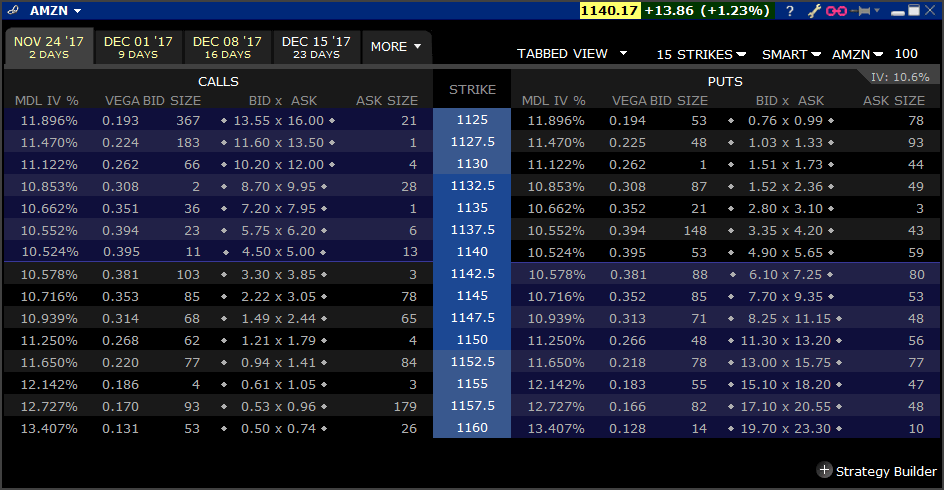
I chose AMZN as it is a high priced stock, which will mean higher Vega values to observe.
These options are only 10 days out, so the forward price for this expiration will be pretty close to the stock price, which is currently 1,140.17. At this stock price the ATM strike on screen will be 1140. The Vega for this strike is 0.395. In this case, the ATM strike does indeed have the highest Vega as the strikes either side taper off and decrease as you move away from the ATM price.
However, notice the implied volatilities shown in the "MDL IV%" column? The vols show the opposite curvature to the Vega; the ATM price is the lowest while the either side of the ATM strike the implied vols increase. The changes to the volatility with this expiration aren't large enough to change the Vega values in this case, but if you do notice higher Vega values outside of the ATM strike, this is likely why.
Black Scholes Vega
Check out my spreadsheet for a working example of Vega using Black and Scholes. Otherwise, here are some code examples:
Excel VBA
Option Vega Formula
Vega = 0.01 * UnderlyingPrice * Sqr(Time) * NdOne(UnderlyingPrice, ExercisePrice, Time, Interest, Volatility, Dividend)Where:
NdOne = Exp(-(dOne(UnderlyingPrice, ExercisePrice, Time, Interest, Volatility, Dividend) ^ 2) / 2) / (Sqr(2 * 3.14159265358979)) dOne = (Log(UnderlyingPrice / ExercisePrice) + (Interest - Dividend + 0.5 * Volatility ^ 2) * Time) / (Volatility * (Sqr(Time)))
38 Comments
harsono September 26th, 2013 at 5:23am
Dear Peter,
Thank you for your explanation, even I cannot get it clearly, it may cause by my English.
At your table, the Vega value is depand on contrack term, I agree with that, but at last colom, the IV , I think IV doent depend on contrack term.
The IV for long term contrack or short term contrack, is same. The IV for today, is same IV for all contrack, even long term or short them.
Peter, how about my second question : If we buy an option with positif vega ( big value of Vega ), it is better we buy at lower IV ( said few days after earnings ) ?
It it true of not ?
Thank you.
Peter September 26th, 2013 at 12:28am
Hi Harsono,
OK - I've thought about it some more, done some simulating with my spreadsheet and think I have figured it out! Thanks for asking the question btw - it will serve as great value for other readers.
Hopefully I can explain it properly.
First, yes, your calculation of Vega is correct - (% Points x Vega x Contract Size). However, as you mentioned you are looking at the Vega of your spread position, which will be the October Vega less the December Vega.
But...the thing is, you are comparing this "spread" position Vega with the IV of the spread, which is likely the average of the two months IV. So, what I think has happened is that volatility has increased for both October and December, however, October has increased by more, which is why you have realised a loss. For example, let's say your original position looks like this;
So I guess the point is that when dealing with calendar spreads you have to be careful when looking at total spread IV when determining risk.
Does this make sense? Let me know if I've missed something or if you disagree.
harsono September 25th, 2013 at 1:34am
Dear Peter,
The value of Delta, Thetha and Vega, I meantion before is net Delta, Net Thetha and net Vega, because I bought CALENDER STRATEGIS ( Multy Legs )
I get these value ( Net Delta, Thetha and Vega ) From TOS ( Think or Swim ), a broker of America.
I also get The IV ( Impled Volatility ) also from TOS, my trading is real account.
I bought this option ( Underlying GOOG ) on 29 Augst, at that time IV was 23.81% and when I check again at 11 September , the IV become 24.28%.
Peter, I change my question become simple one, If I buy an option , price 6.55 with Vega positif, said 888 ( same meaning 0.888 ). If the IV increase from 25% to 27%, and the other factor are unchange, I will get gain 1.776 ( 2 x 0.888 ), it mean the price for this option become 8.326 ( 6.55+1.776 ) , this is right or not ?
In other words, if the Vega Posiftif , with big value, we should buy the option, when the IV is at lower lever ? This is right ?
Peter, so sorry if my english is not good, because English is not my mother tongue. Could you answer my 2 question above ? Because I trascation in option in big amount, but I am not sure about the VEGA.
For Others like Delta, Gamma, Thetha, Rho I can understand cleary, but Vega I am not sure,because I already try at my real account, but VEGA works opposite from the theory.
Thank you .
Rgds,
Harsono
Peter September 23rd, 2013 at 8:14pm
Hi Harsono,
I see now. I think the confusion is likely to be related to the volatility. You've mentioned that the IV at the time was 23% - but where does this value come from? Is it a published number that you're using?
The reason I'm being specific here is that your spread is made up of two options that expire in different months - each will have a different volatility. Typically the back months have higher implied volatilities as the markets are less certain as time increases (expcept if the market is unusually volatility where traders might expect future volatility to come off current levels).
So it could just be that the back month option IV has dopped while the front month has risen netting out to be a decrease in overall IV for the spread.
Sorry I couldn't answer specifically - it's hard to answer without all the numbers, which I understand are difficult to come by at this point.
harsono September 19th, 2013 at 6:22am
Oh sorry Peter,
I forgot to tell you, I bought Calender Strategic, Sell October , Strike 910 and Buy Desember , Strike 910. Option price :6.8.
IV at that time was 23%
Delta = Positive 64, Theta positif 223 and Vega positif 831.
After Few day, the GOOG price increse , the IV also increase to 24.5%, but my option price down to 6.6 ( it mean I loss $20 per contrack ), how come be like this ?
The price of this posisition should have some gain ? Because the Delta is Positif, and the underlaying is increase , the Theta is positif, it means I should get some time decay value, and also the Vega is positif, The IV increse 1.5%, I should get some gain also.
But in actual trading , why my posisition of this underlying ( GOOG ) become loss ?
Thank you.
Peter September 17th, 2013 at 4:42am
Hi Harsono,
Apoligies - I'm not exactly sure of your example - is this an outright option or an option spread? I ask because you've referenced two months. Also, the Theta for an outright long option will be negative.
So is the 6.8 price the total combo price or one of the legs?
harsono September 16th, 2013 at 10:52am
Dear Peter,
Thank you for your explanation .
But in actual trasaction, I buy GOOG , - October + November at stike 910 on 10 September, the underlaying at 888,1 the option price was 6.8. IV at that time was 0.23.
Delta = Positive 64, Theta positif 223 and Vega positif 831.
Today, the underlayingGOOG become 890.05 (increase ) IV now = 0.245 ( increase ), and of couse the I get some theta value, but now my option price become 6.6. Why ?
However, the option price should be more than 6.8 ?
Thank you.
Harsono
Peter September 9th, 2013 at 5:48am
Hi Harsono,
A negative Vega means that the value of your long position will decrease if the volatility of your position increases.
I.e. say the position Vega of your spread is -0.65 and you paid 19.50 for the position. If the volatility increases from 30% to 31% then, all other things remaining unchanged, the value of your position will decrease to 18.85 (19.50 - 0.65).
harsono September 6th, 2013 at 10:44am
Dear Peter,
When I buy option with butterfly strategic, the net vega is negatif in huge number, what is mean ?
And I should buy at this strategic( butterfly ) , when the IV at low lever or high lever ?
Thank you.
Peter August 2nd, 2012 at 5:53am
Hi Vega,
I think the shape of the vega is consistent with the shape of volatility curve. The shape definitely shouldn't be linear as option prices do not follow a linear curve.
Add a Comment