Option Strategies
Combine calls and puts to construct specific price outcomes. Option strategies give you the flexibility to profit from rising, falling and directionless markets.
Bullish strategies
Profit from a Rising Market
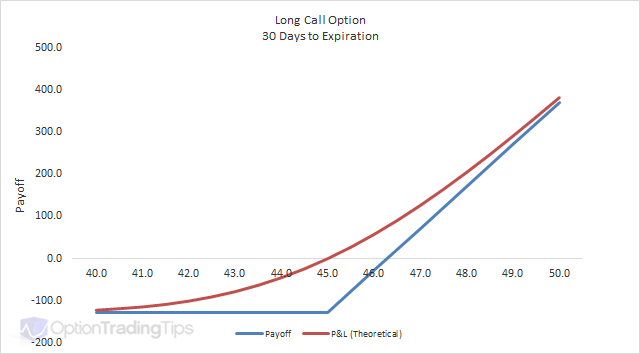
Long Call Option →
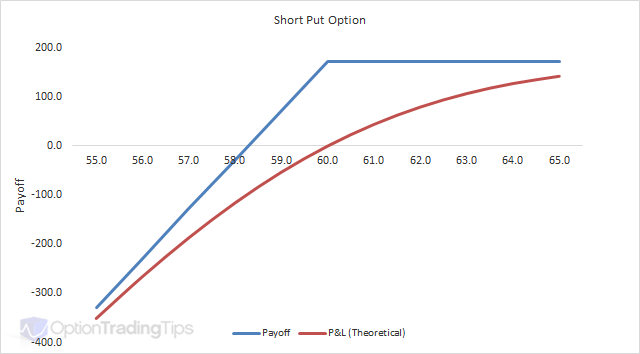
Short Put Option →
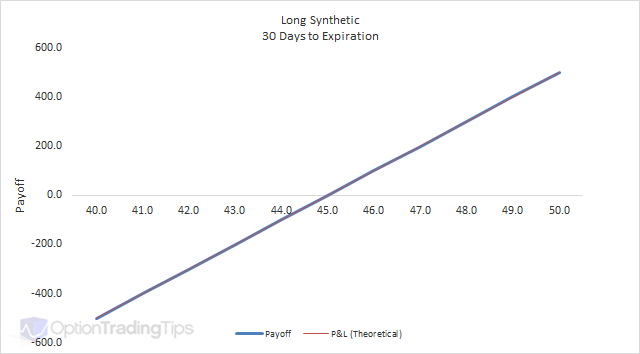
Long Synthetic →
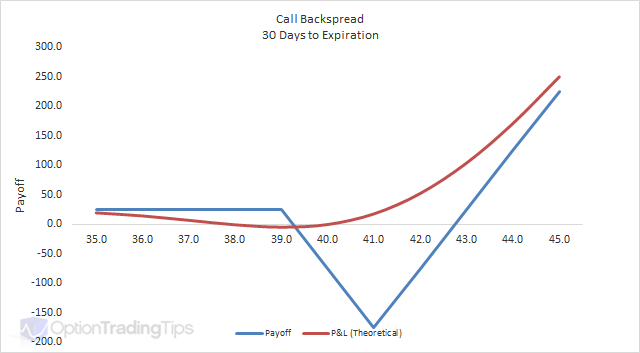
Call Backspread →
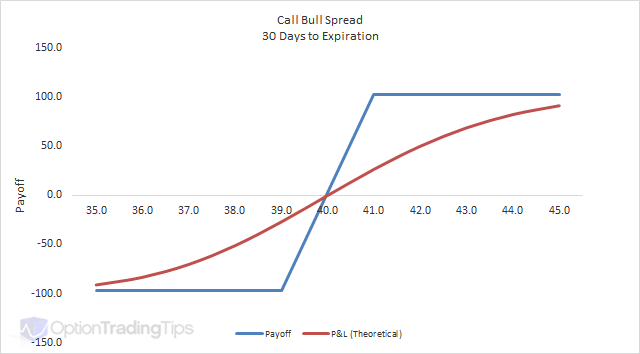
Call Bull Spread →
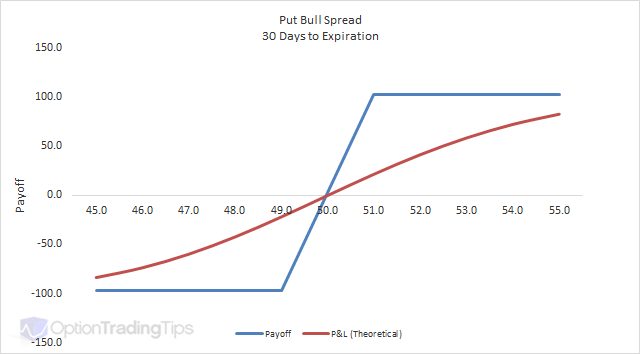
Put Bull Spread →
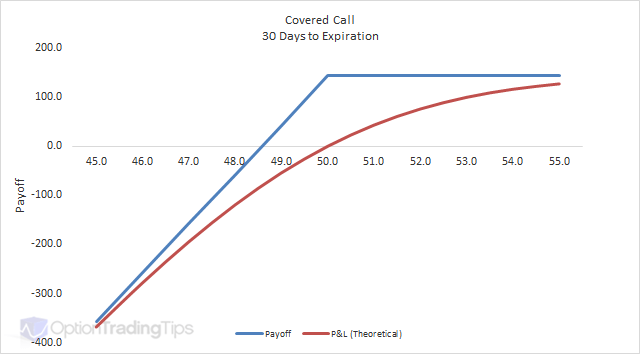
Covered Call →
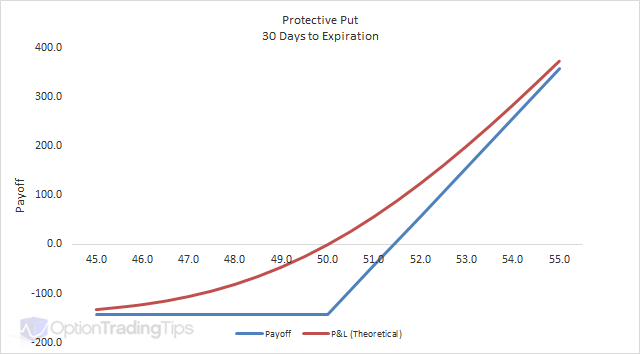
Protective Put →
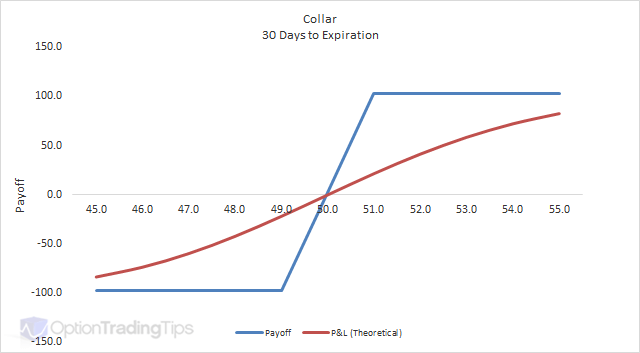
Collar →
Bearish strategies
Profit from a Falling Market
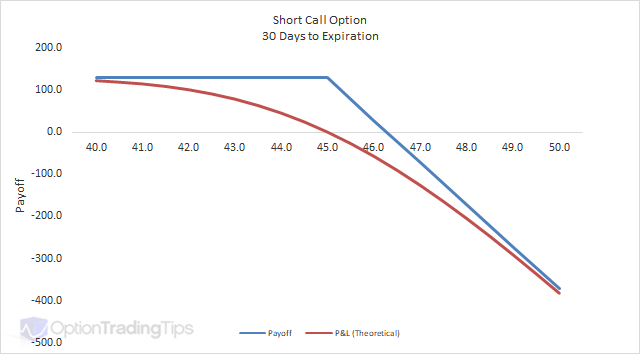
Short Call Option →
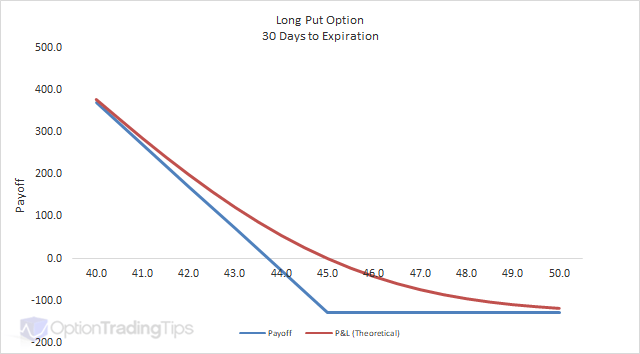
Long Put Option →
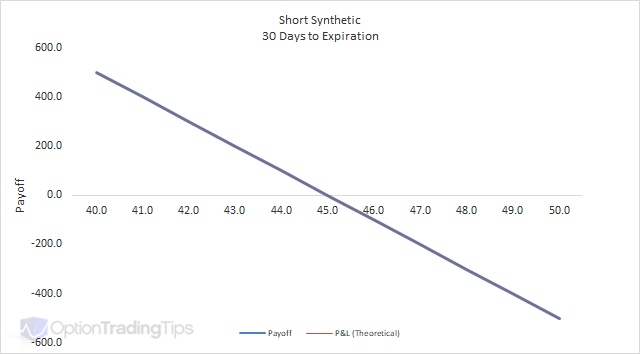
Short Synthetic →
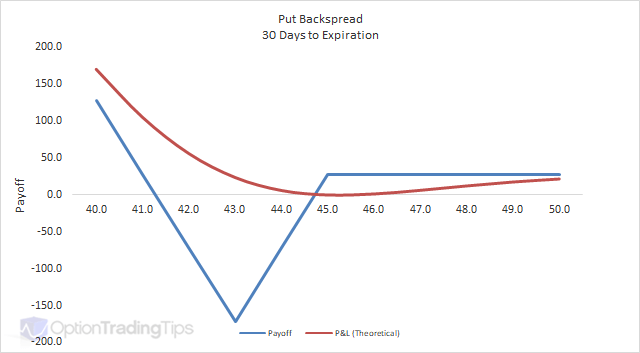
Put Backspread →
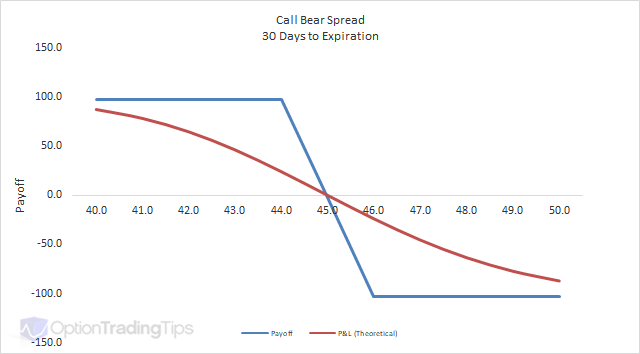
Call Bear Spread →
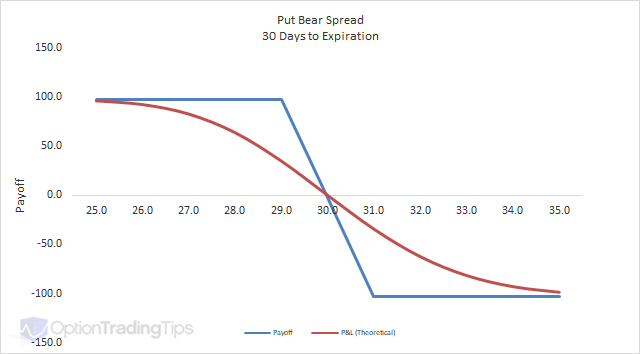
Put Bear Spread →
Market neutral strategies
Profit in a Sideways Market
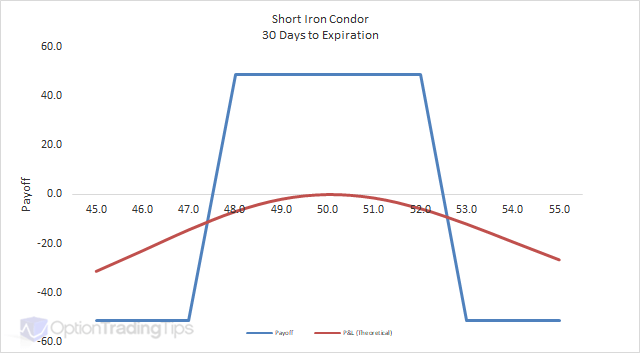
Iron Condor →
Long Straddle →
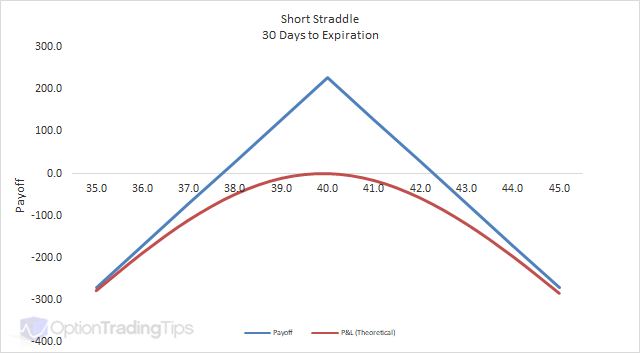
Short Straddle →
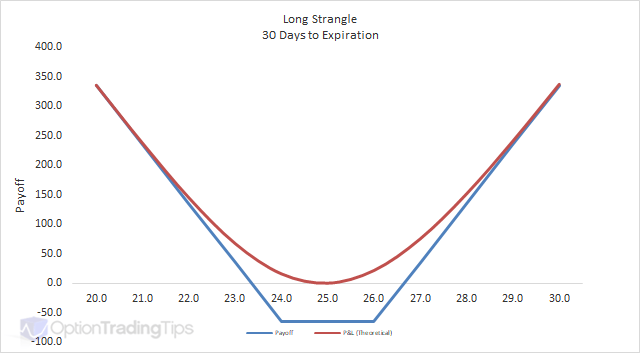
Long Strangle →
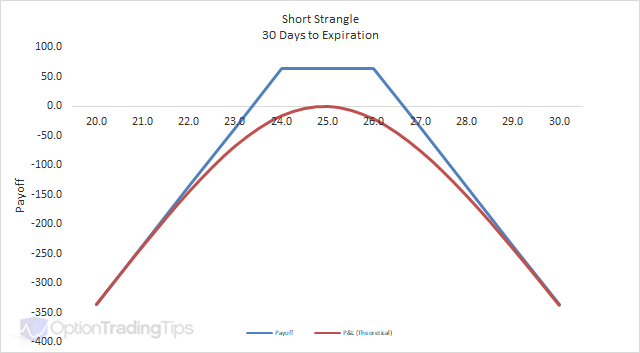
Short Strangle →

Long Guts →
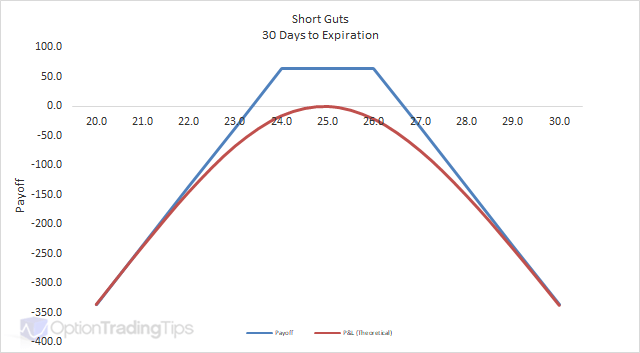
Short Guts →
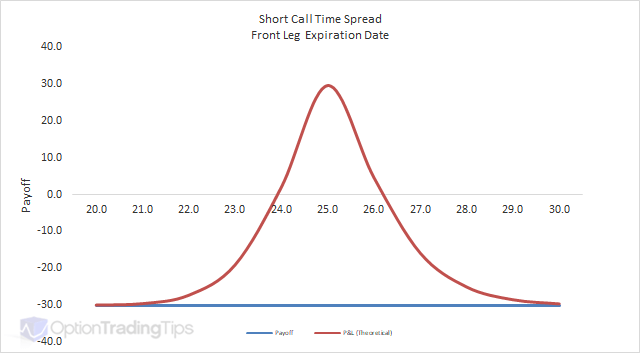
Call Time Spread →
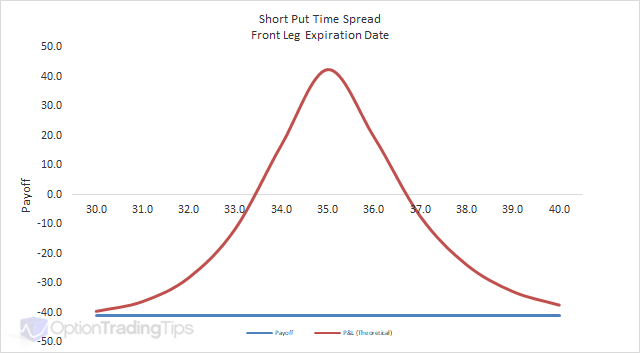
Put Time Spread →
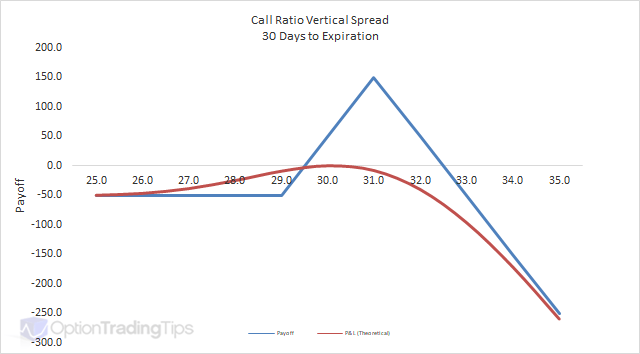
Call Ratio Vertical Spread →
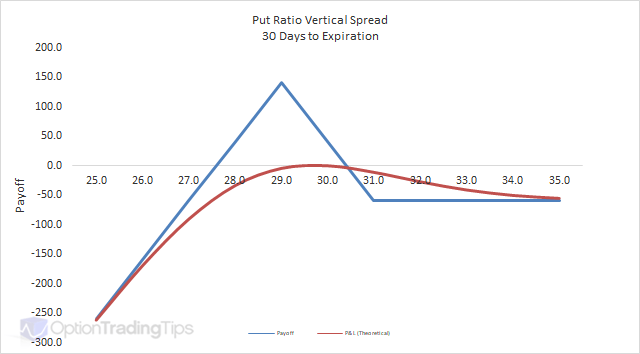
Put Ratio Vertical Spread →
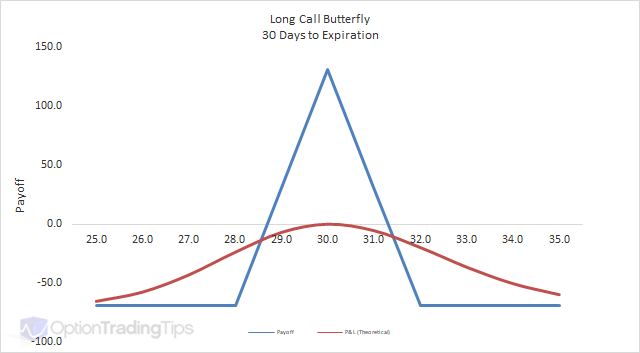
Long Call Butterfly →
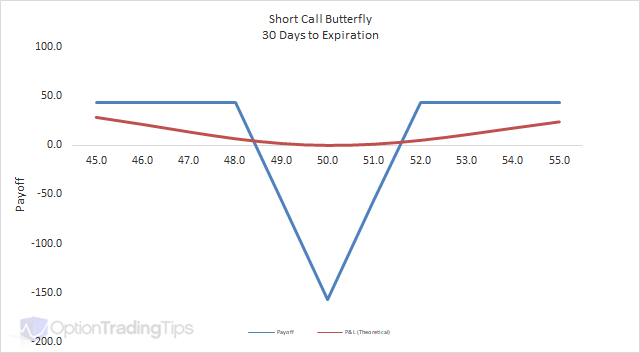
Short Call Butterfly →

Long Put Butterfly →
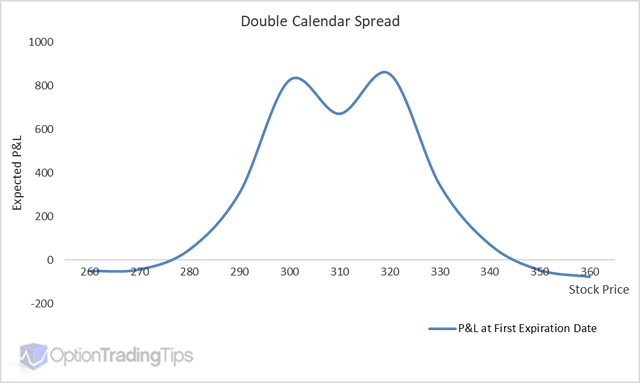
Double Calendar →
About Option Strategies
Generally, an option strategy involves the simultaneous purchase and/or sale of different option contracts, also known as an option combination. There is such a wide variety of option strategies that use multiple legs as their structure, however, even a one legged Long Call Option can be viewed as an option strategy.
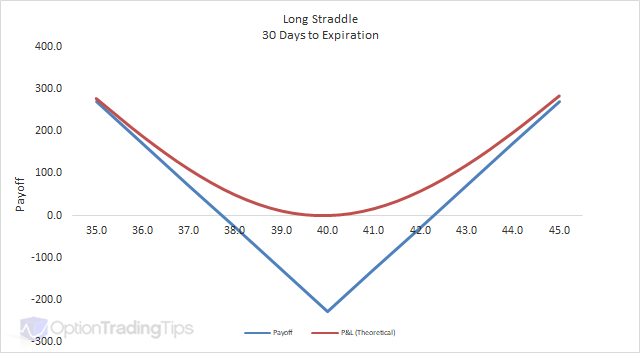
But what if you bought a call and a put option at the same strike price in the same expiry month? How could a trader profit from such a scenario? This is called a Long Straddle — one of the most popular market neutral strategies.
In this example, imagine you bought 1 $40 July call option and also bought 1 $40 July put option. With the underlying trading at $40, the call costs $1.14 and the put costs $1.14 also — a total outlay of $228, which is your maximum loss.
If the market rallies, the call option becomes increasingly profitable while the put expires worthless. If the market sells off, the put becomes profitable while the call expires worthless. Either way, as long as the move is large enough to exceed the $228 cost, you profit.
This is just one example of an option combination. There are many different ways to combine option contracts together — and also with the underlying asset — to customise your risk/reward profile.
For further analysis tools, take a look at the Volcone Analyzer — it analyses any option contract and compares it against historical averages, helping you decide whether to buy or sell.
105 Comments
Peter June 7th, 2020 at 3:50am
Hi Kamal,
Yes, you can use the calculator for any option. Can you share an example...i.e. what parameters are you using?
Peter.
Kamal June 6th, 2020 at 6:52am
Hi,
How to use the option calculator for BankNifty and Nifty option pricing. The fair price values are way higher than the market values. Could you guide on the same.
BR
Kamal
Peter December 6th, 2016 at 7:19pm
Hi Luciano,
Yes, it represents your P&L movements today when the stock price changes by the amount on the x-axis.
Luciano December 6th, 2016 at 7:22am
Hi Peter,
Thanks for your help.
So does the pink line represent the P/L of my position today? I mean the P/L that I should have if I close the strategy today?
Thank you and regards.
Luciano
Peter December 1st, 2016 at 5:15pm
Hi Luciano,
The pink line represents the change in the value of the position relative to the current theoretical price.
At the center of the graph the pink line will always be zero because if you bought/sold the spread now at the current market price you will not have made or lost anything. But if the market price moves, which is represented by the x-axis your estimated (theoretical) P&L will change by the amount illustrated by the pink line - all other things being equal.
As the expiration date approaches, the pink line moves closer to the blue/payoff line. This line, at the expiration date, will be the most you can gain or lose for each corresponding x-axis (stock price) point.
Hope this is clear, please let me know if not.
Luciano December 1st, 2016 at 8:48am
Hi Peter,
could you please explain me what is the pink line in your graph (P&L+60 days) and in the Option Trading Workbook spreadsheet (which is called: Current Theoretical P&L Relative to Underlying Price Changes)?
You did a great job for newbies like me! Thank you.
Luciano.
Peter November 18th, 2015 at 3:59pm
Hi Renee, yes they are already added as either long or short i.e. Long Straddle and Long Strangle.
Renee November 17th, 2015 at 8:55pm
Could add Strangle or Straddle?
Igwe Zachary Githaiga March 30th, 2014 at 3:35am
so,what are the strategies in option trading
bee February 25th, 2014 at 4:05pm
If I've actually short a stock and it now is trading higher, is there any option repair strategy I can use to limit my loss? Most option repair strategy only gives example starting out with a long position on a stock.
Add a Comment