Long Synthetic
| B/S | Strike | Type | Price |
|---|---|---|---|
| Buy 1 | $45 | Call | $1.29 |
| Sell 1 | $45 | Put | $1.29 |
| Net | $0 | ||
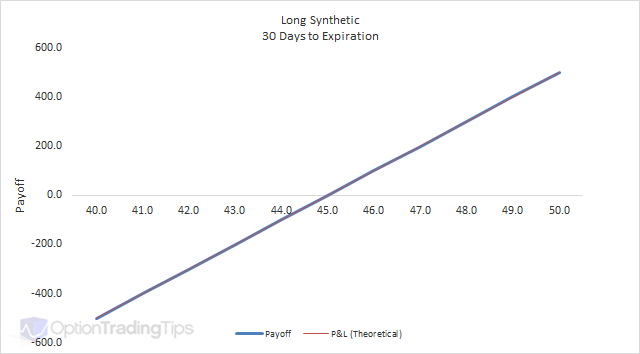
A long synthetic is buying a call and selling a put with the same strike price in the same expiration month. It is called a synthetic as the profile replicates a long position in the underlying. As a result;
The Max Loss increases as the market falls but like a long stock position is ultmately limited to the total investment of the position. In this case it is limited to the value of the position at the strike price. I.e in this example it would be -$4,500.
The Max Gain is uncapped as the market rises.
Characteristics
When to use: When you are bullish on market direction.
Long Synthetic behaves exactly the same as being long the underlying security. You can use long synthetic's when you want the same payoff characteristics as holding a stock or futures contract. It has the benefit of being much cheaper than buying stock outright.
Long Synthetic Greeks
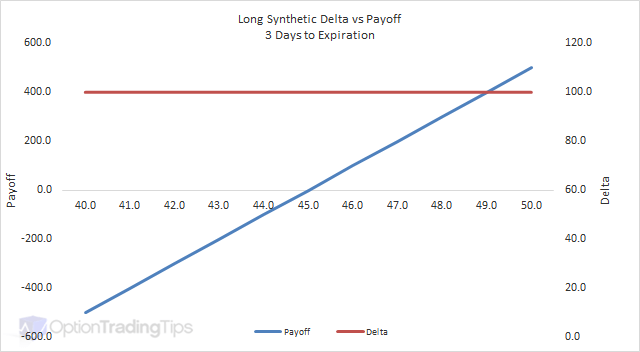
Delta

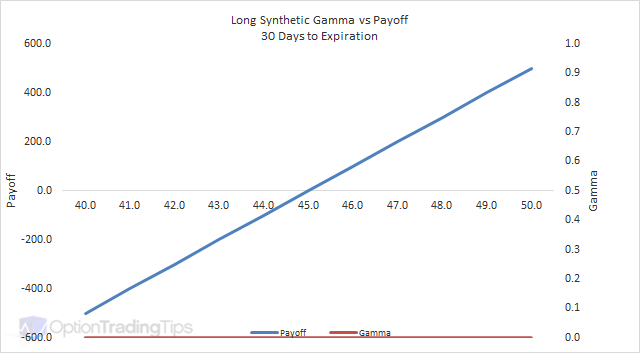
Gamma

Vega


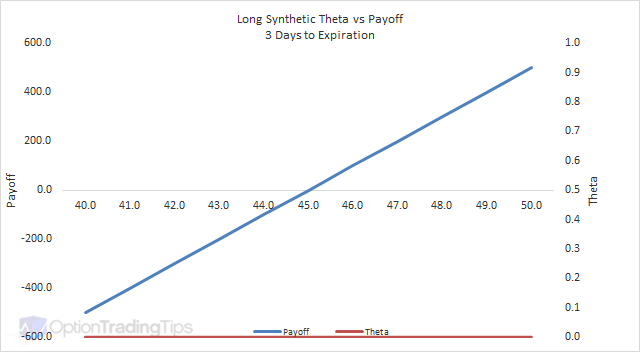
Theta

32 Comments
Peter June 24th, 2018 at 10:30pm
Hi hhcool1,
If you have the capital and want to own the shares, then you could consider closing both and buying the stock outright. Given the expiration is 18 months away, you're missing out on any dividends from the stock by buying the synthetic instead of the shares.
hhcool1 June 20th, 2018 at 12:10pm
I'm sitting on a synthetic long position with TTD.
sold a short put Jan 2020 $45
bought a long call Jan2020 $45
TTD today is close to $93
I would like to own and keep the shares.
When does it make sense to exercise? The put is secured with cash that I could use elsewhere, however there is still a lot of time value left in it , so it would cost about $330 to but it back.
Is the right thing to do just leave it alone until Jan 2020?
Peter April 15th, 2012 at 10:10pm
Hi Hel,
Apologies for the delayed response. Thanks for the feedback too :-)
You're right about the cash flows - you will receive $500 credit for this synthetic. You're also right about the P&L;
When APPL is at 628;
- The call is worthless and you lose the 3,600 paid.
- The put is ITM and will be exercised. You will need to deliver the stock at 630 and buy it back at 628 for a loss of 200. But you have already received 4,100 credit for selling the put so the gain for the put is 3,900.
- Total gain for the trade at 628 is 300.
When AAPL is at 632;- The call is ITM and will be exercised. You will be long the stock at 630 and given a market price of 632 you will be ahead 200 on the stock. However, you need to take away the 3,600 spent for the option. Net is a loss of 3,400.
- The put is worthless. You will keep the premium received, which is 4,100.
- Total gain of 700.
The breakeven point is the strike +/- premium. So in your case it is 630 - 5 = 625.You can choose whatever strike you like so if you don't want ITM puts just choose a lower strike so the calls are ITM.
Hel April 12th, 2012 at 3:52pm
Hi Peter, your site is by far the best site that explains Options concepts! I have been promoting it among my friends and they all love it.THANK YOU
Here's a number questions for this strategy. For ex, if I:
Long AAPL call @strike price 630 - price is 36
Short AAPL put @strike price 630 - price is 41
(both expires on June 12)
Today's Cash flow would be
(3600)+ 4100 = 500
If AAPL trades@628 on June 12,cash flow will be:
(63,000)+62,800 = (200)
If AAPL trades@632 on June 12, cash flow will be:
(63,000)+63,200 = 200
Here's my questions: it looks like if make money regardless?! just a matter of different return
500+(200)=300 or 500+200=700
- How do i calculate my breakeven point?
- Do I HAVE to always to short a ITM put? what if people exercises it??
I might have confused myself through the process and made some non-sense, please bear with me.
thanks a million
Dr. John February 20th, 2012 at 6:58pm
You are correct about the downward slope. But it's not unlimited; it's bounded. The lowest the stock can fall is to zero. The reason the upside on long calls is unlimited is because there is no cap on a stock's price. In theory, a stock's price can go to infinity -- that's why we say unlimited or unbounded.
Peter February 19th, 2012 at 5:04pm
Hi Dr. John,
That's not correct - the downside for a short put is that you will be assigned the stock at the strike price so as the stock falls you lose $1 for every $1 the stock drops - hence the downward sloping graph above.
Dr. John February 19th, 2012 at 9:43am
The upside is unlimited. The downside is limited. Thus, the risk/reward profile given by this site is not correct. The most you can lose when you write a put is the strike price minus the premium.
Peter July 30th, 2011 at 6:50am
Sounds about right...depends on the strikes that you buy/sell, how close to expiration the options are etc but you're on the right track.
Matt July 29th, 2011 at 7:37pm
It seems to me that the synthetic long will resemble the underlying long, except both gains and losses are magnified by (almost) the same factor. So, considering a net debit of $50 for a 100 strike price long synthetic: A $5 (5%) increase will result in a $450 profit; a $5 decrease will result in a loss of $550. In other words the synthetic long's results would be a 900% gain/1100% loss, whereas a long position in the asset would result in just a 5% change.
Am I on the right track?
Peter July 11th, 2011 at 7:27pm
The loss is said to be unlimited as there is no floor to the payoff as there is with a long call or long put. Your losses will continue to increase as the market price of the underlying decreases.
Add a Comment