Option Strategies
Combine calls and puts to construct specific price outcomes. Option strategies give you the flexibility to profit from rising, falling and directionless markets.
Bullish strategies
Profit from a Rising Market
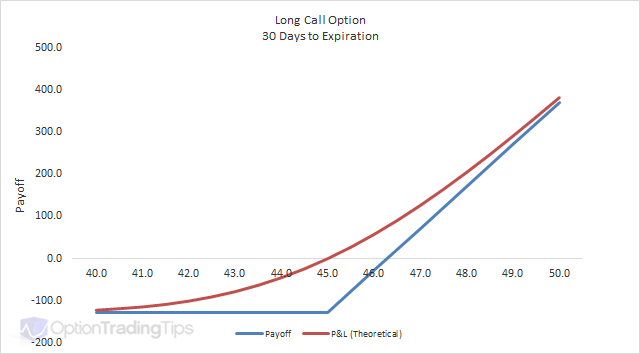
Long Call Option →
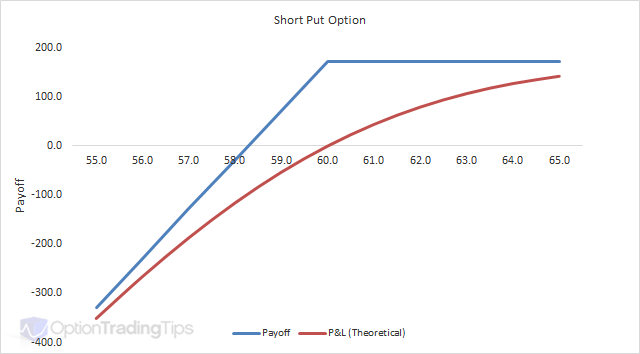
Short Put Option →
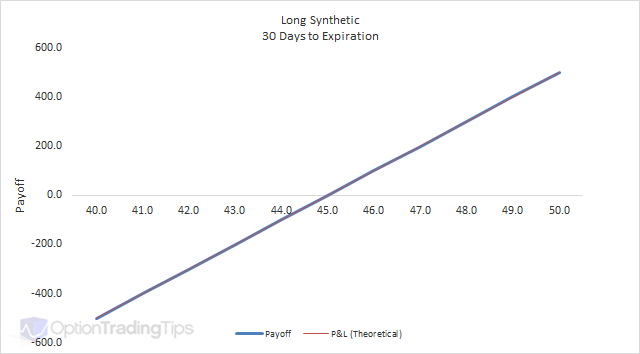
Long Synthetic →
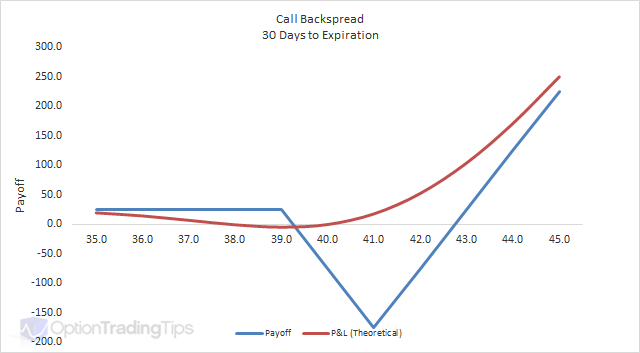
Call Backspread →
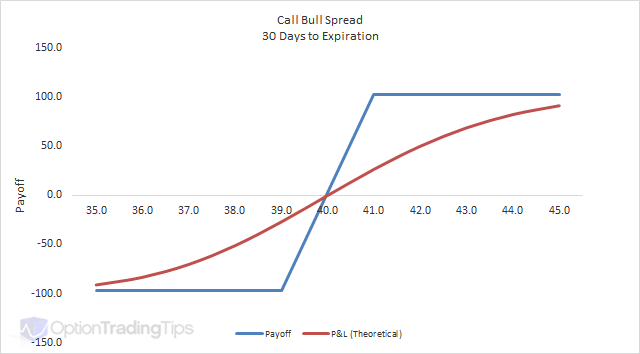
Call Bull Spread →
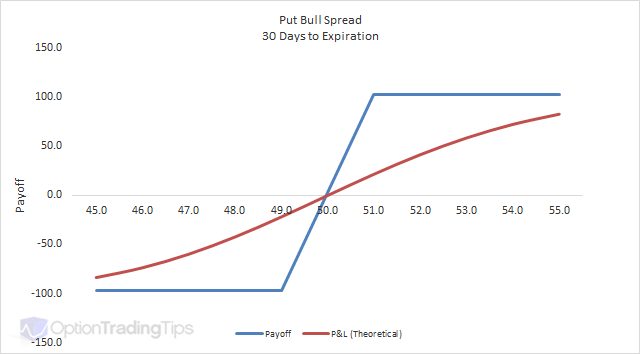
Put Bull Spread →
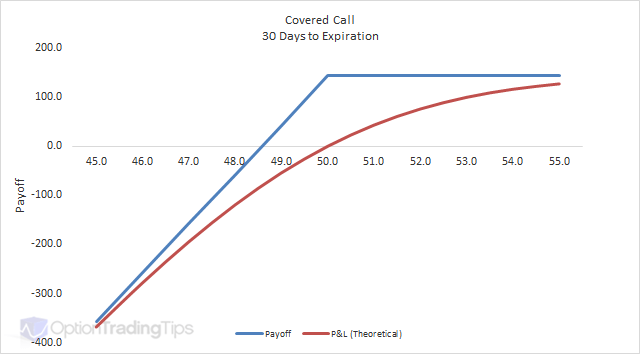
Covered Call →
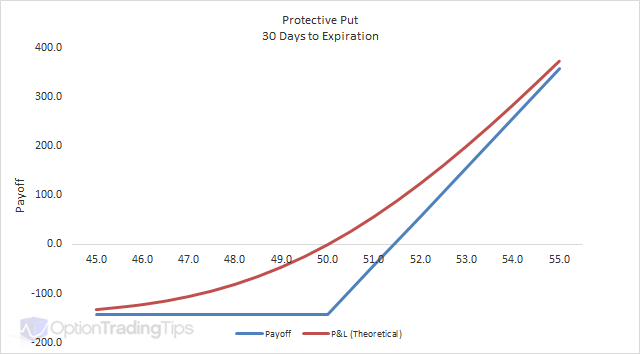
Protective Put →
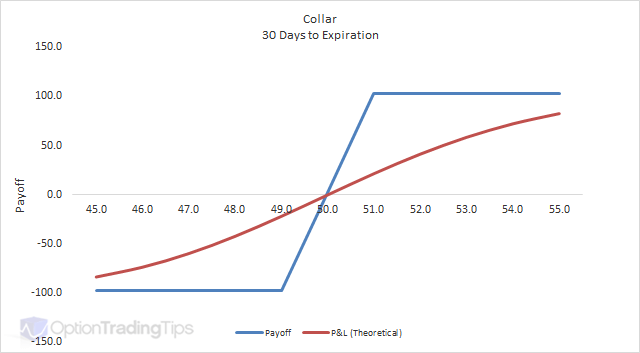
Collar →
Bearish strategies
Profit from a Falling Market
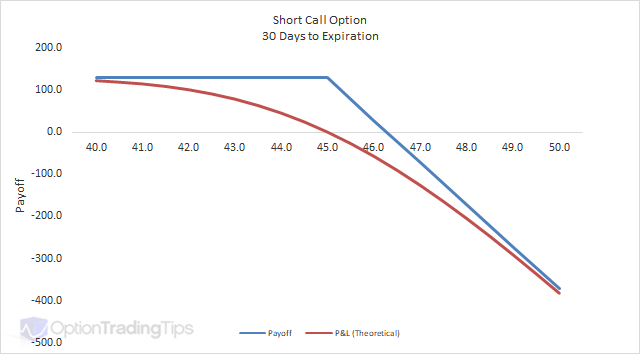
Short Call Option →
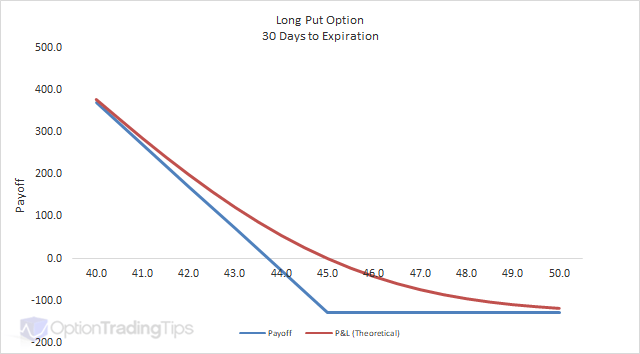
Long Put Option →
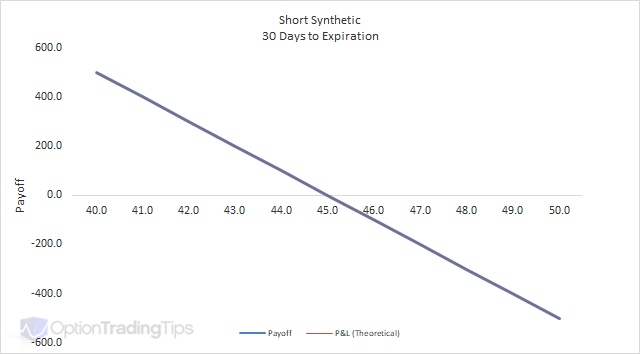
Short Synthetic →
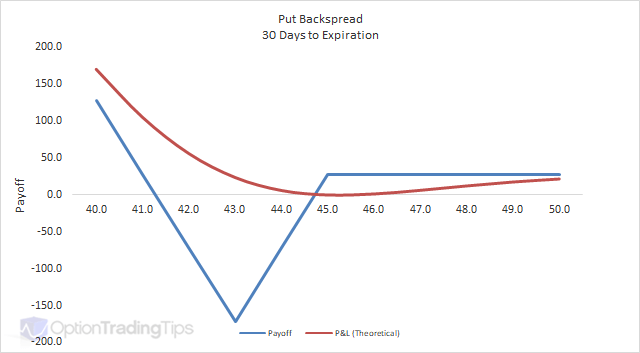
Put Backspread →
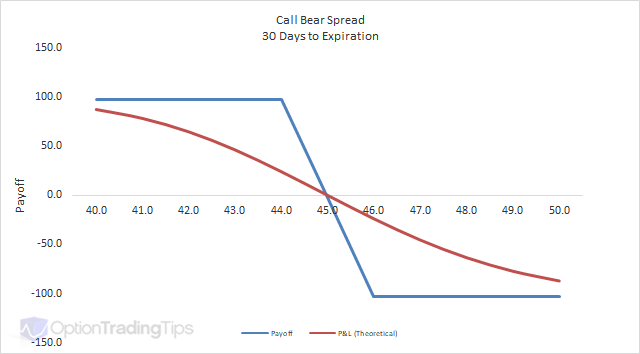
Call Bear Spread →
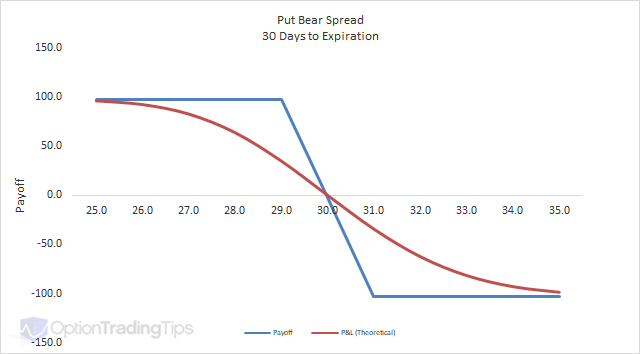
Put Bear Spread →
Market neutral strategies
Profit in a Sideways Market
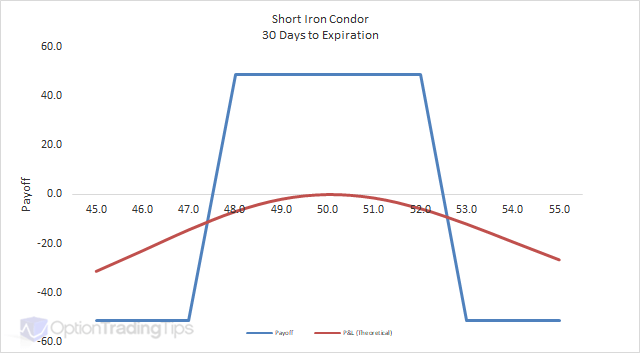
Iron Condor →
Long Straddle →
Short Straddle →
Long Strangle →
Short Strangle →
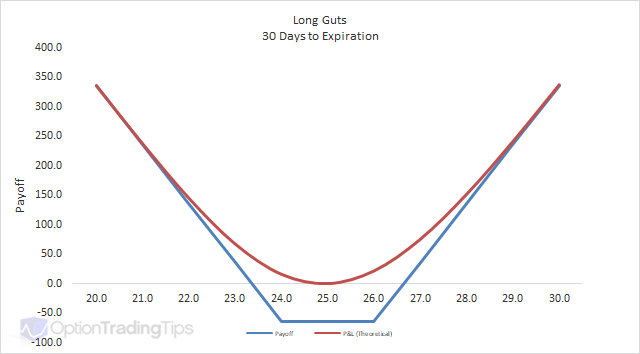
Long Guts →
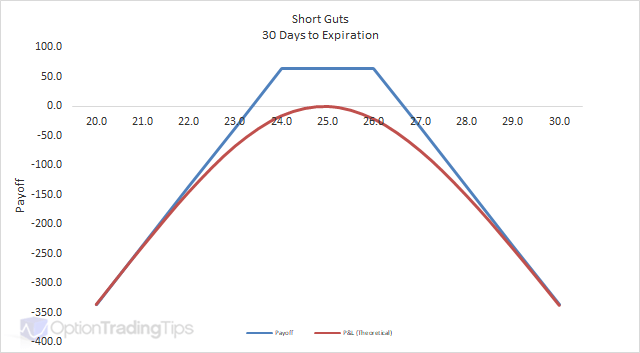
Short Guts →
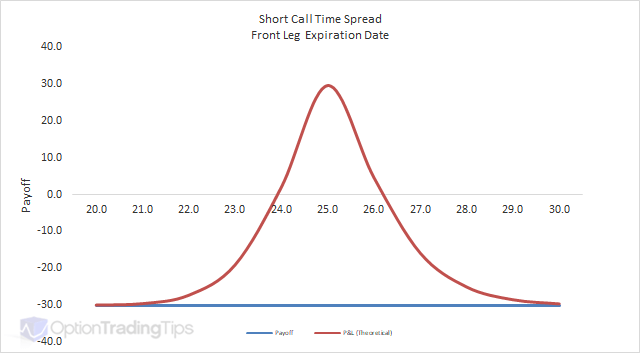
Call Time Spread →
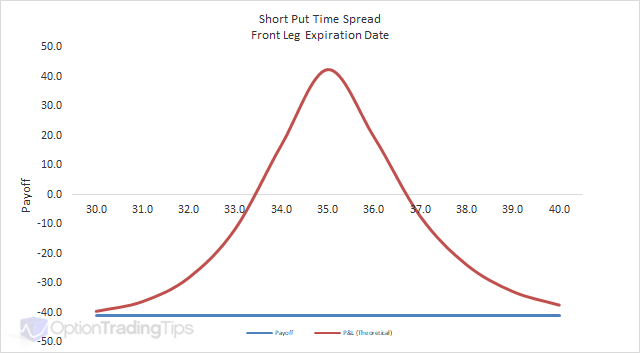
Put Time Spread →
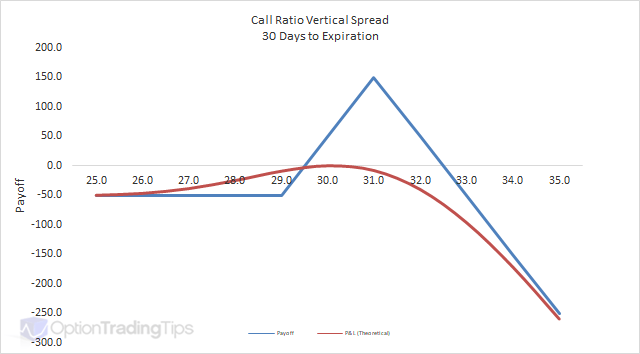
Call Ratio Vertical Spread →
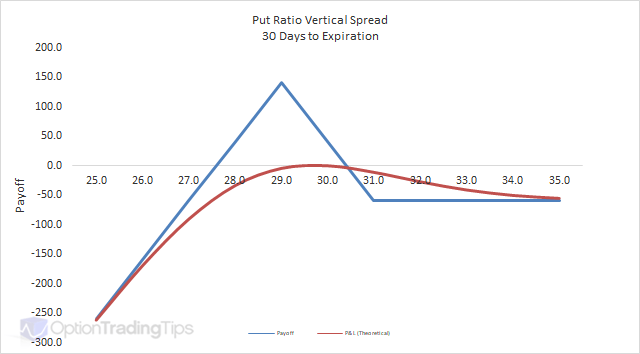
Put Ratio Vertical Spread →
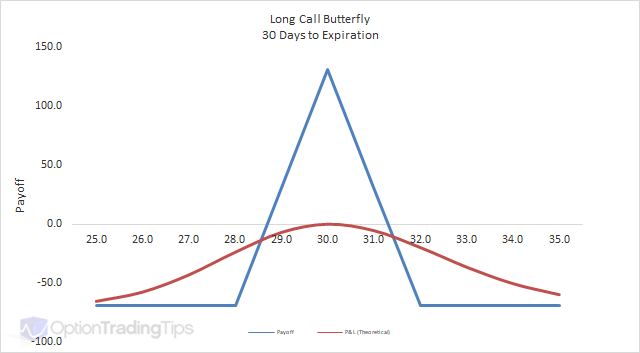
Long Call Butterfly →
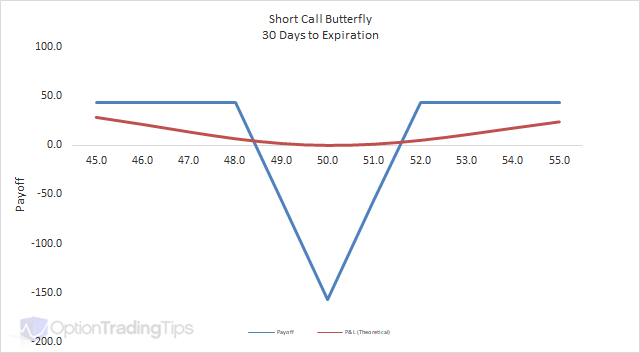
Short Call Butterfly →
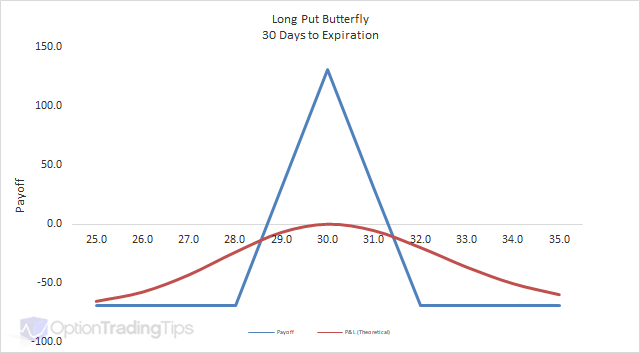
Long Put Butterfly →
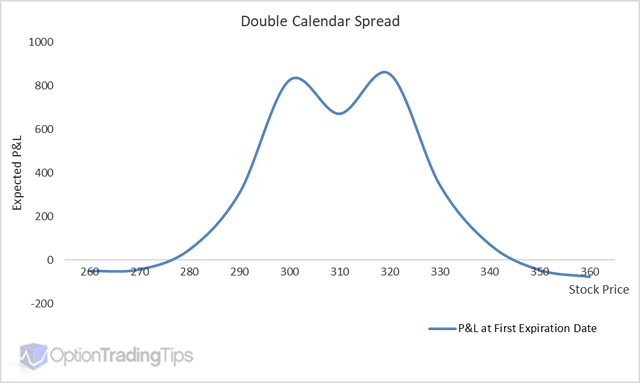
Double Calendar →
About Option Strategies
Generally, an option strategy involves the simultaneous purchase and/or sale of different option contracts, also known as an option combination. There is such a wide variety of option strategies that use multiple legs as their structure, however, even a one legged Long Call Option can be viewed as an option strategy.
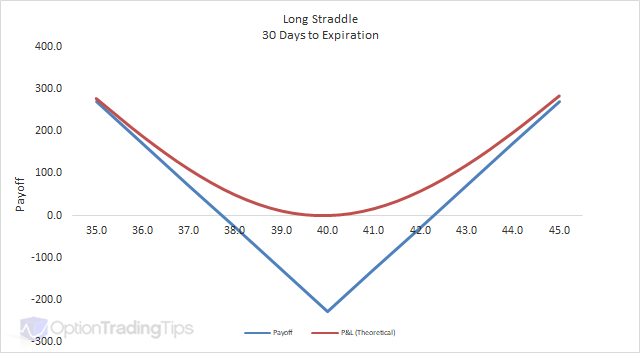
But what if you bought a call and a put option at the same strike price in the same expiry month? How could a trader profit from such a scenario? This is called a Long Straddle — one of the most popular market neutral strategies.
In this example, imagine you bought 1 $40 July call option and also bought 1 $40 July put option. With the underlying trading at $40, the call costs $1.14 and the put costs $1.14 also — a total outlay of $228, which is your maximum loss.
If the market rallies, the call option becomes increasingly profitable while the put expires worthless. If the market sells off, the put becomes profitable while the call expires worthless. Either way, as long as the move is large enough to exceed the $228 cost, you profit.
This is just one example of an option combination. There are many different ways to combine option contracts together — and also with the underlying asset — to customise your risk/reward profile.
For further analysis tools, take a look at the Volcone Analyzer — it analyses any option contract and compares it against historical averages, helping you decide whether to buy or sell.
105 Comments
Peter December 3rd, 2013 at 2:52am
Hi Terry,
Aplogogies for the delayed response!
The ATM point will be at the "forward" price, which will be slightly higher than the stock price depending on the interest rate. If interest rates are zero then the ATM price will be the stock price.
I'm not really sure what the best volatility to use actually is. Some prefer to stick to a one year rate while others will use an historical level appropriate for the expiration of the options.
What is the website you're looking at for the vols?
Terry B November 25th, 2013 at 5:21pm
Hello, just downloaded your spreadhseet. Awesome stuff.
Two questions:
I'm, mainly interested in the deltas for my particular use.
a) For the default model stock price of $25.
I noticed that the at the money calls were at .52
and the at the money puts were at -.48
Shouldn't the .calls be at .50 and the puts at -.50
Also, I came across a site that post's historical volatilities for a stock.
1mo, 2 mo, 3mo, 6mo, 1yr, 2 yr, and 3yr.
Which would be the best to plug in to your spreadsheet to calculate most accurate delta's. The shortest term 1mo ?
thanks .... great spreadsheet
Jayant October 15th, 2013 at 12:23am
Dear admin can u suggest me any new strategy except these strategies..i want some new strategy, m well known all this strategies because m the trainer of options market in kolkata and m also certified with NSE.
Peter August 26th, 2013 at 6:18pm
Hi Steve,
It is the theoretical P&L calculated with 60 days left to maturity.
Steve August 26th, 2013 at 7:33am
What exactly is the pink line in the diagrams? It appears to be some average over time but I can't find a definition anywhere.
alvaro frances April 15th, 2012 at 5:03pm
Amit Bhutani hello, please can you explain the strategies that spelling on March 17, 2012 the day that I describe below, thanks
1)Long Combo + Nifty Short
2) Combo corto + largo Nifty 2)Short Combo + Nifty Long
3) Put / Call Ratio spreed 3)Put / Call Ratio spreed
4) Coloque el oso spreed / Spreed Bull de llamadas. 4)Put bear spreed / Call Bull Spreed.
Peter March 27th, 2012 at 5:05pm
Hi James,
Right - the OptionTradingWork book is currently onlt Black and Scholes. For American options you can use the Binomial Model - there is a spreadsheet on the Binomial page.
James March 27th, 2012 at 7:02am
Hi I've used the Option Trading Workbook.xls and compared it to bloomberg valuations and it is slightly out. Specifically I'm talking about american options on the ES mini contract, eg ESU2C 1350 Index
Does this pricer work for american options, or is it just for european?
Any chance we get an american options enabled one?
:-)))))
Peter March 26th, 2012 at 7:47pm
Hi Rakesh,
You can write a call/put on the basis of;
a) creating a naked position because you are bullish/bearish on the underlying
b) as part of a combination such as a covered call, which is used primarily to gain additional income on an existing stock position.
Amit S Bhuptani March 17th, 2012 at 1:12pm
Dear All,
Best strategy which I have come across.
1)Long Combo + Nifty Short
2)Short Combo + Nifty Long
3)Put / Call Ratio spreed
4)Put bear spreed / Call Bull Spreed.
Regards
Amit S Bhuptani.
PMS ICICI Sec Ltd.
Add a Comment