Expiration Summary 15th April
I had positions in 5 stocks who's options expired on the 15th. Only 2 out of the 5 were successful, however, those two had gains that exceeded the losses by the other 3. The net P&L was up $284.20. Below you will find the summary and breakdown of each position.
| Trade | Open | Days | P&L |
|---|---|---|---|
| RCL Put Spread | 24-Mar-16 | 22 | -143.5 |
| RIG Put Spread | 30-Mar-16 | 16 | -56.7 |
| VZ Long Call | 30-Mar-16 | 16 | -101.6 |
| JWN Long Put | 30-Mar-16 | 16 | 364.2 |
| C Straddle | 31-Mar-16 | 15 | 221.8 |
4 out of the 5 trades taken below I took on as a result of the scans produced by the Option Scanner Pro. So far so good! The $197 spent of the software has just paid for itself from the below trades. I'll keep taking trades from it and posting the results
JWN Long Put 30th March
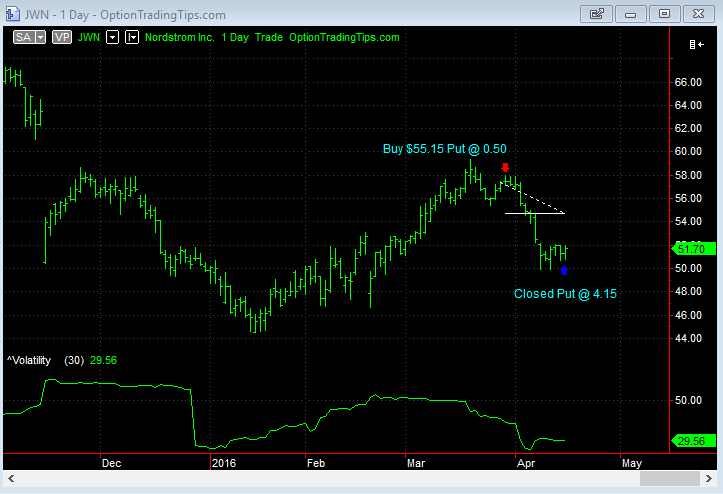
The biggest win of this set was Nordstrom (JWN).
On the 29th March, the Option Scanner showed the $55.15 puts trading 10,153 over 2,585 in open interest. Looking at the options chain for the April expiration it was a standout level compared to the other strike prices.
Nordstrom stock ended the 29th trading at $57.31
I placed a limit order to buy the $55.15 put option for 0.50. The closing market on the 29th was 0.51 @ 0.52. My order was executed on the 30th giving me a long position in the $55.15 put at 0.50.
Since then, in 16 days the stock has tanked 9.8% to end the week trading at $51.70.
I sold the put option back on the open on Friday for 4.15, making an 830% return on the initial purchase price of 0.50.
C Long Straddle 30th March
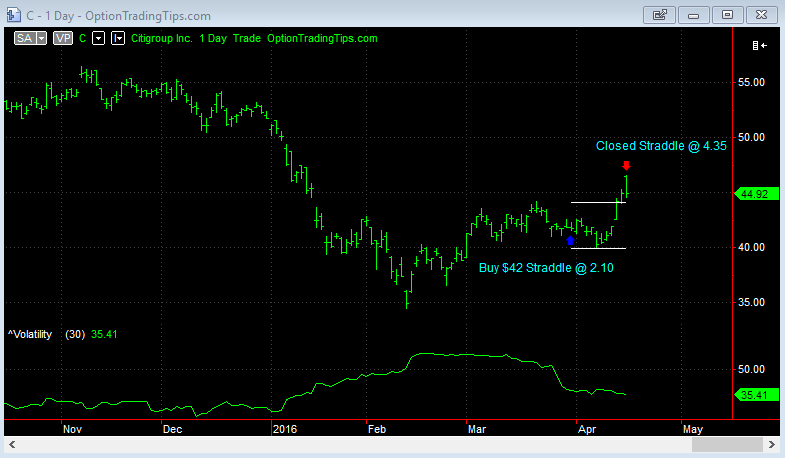
Citi was also identified as a potential opportunity from the Option Scanner. There was some call volume on the $42 strike on the 28th and 30th and also $42 puts had some volume go through on the 30th.
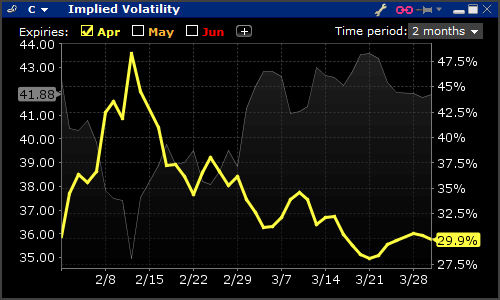
It wasn't huge; 4k total over 2k in open interest. But, I looked and noticed that they had an earnings result coming up on the day of expiry. The price looked ok when I had a look at the chart and the implied volatility was relatively low at 29.9%.
The earnings result for Citi reported lower than expected profit for Q1 but the stock still jumped when the market opened. I sold the call leg of the straddle on the open and realized a profit for the combination of $221.80.
RCL Put Spread 24th March
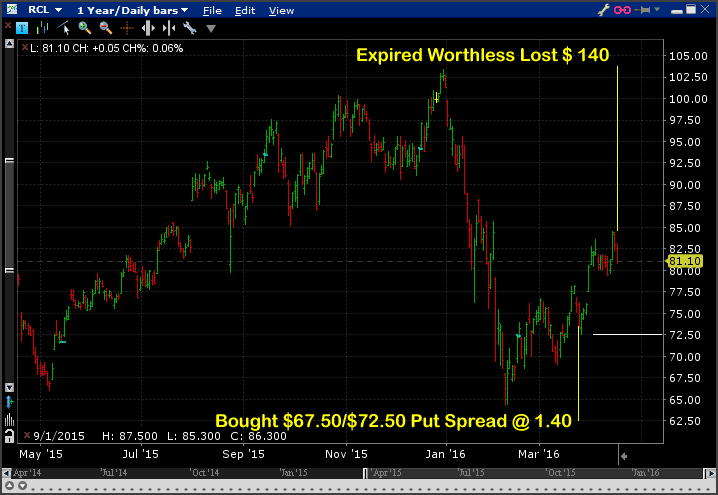
I thought I was onto a winner with this one - RCL showed up on the Option Scanner with significant volumes going through the $67.50 and $72.50 put options. 8.5k total over 1.4k in open interest. Across the board this was a significant amount of action.
So I bought the $67.50/$72.50 put spread the next day but the stock immediately rallied and the spread expired worthless and my loss was $140.
RIG Put Spread 30th March
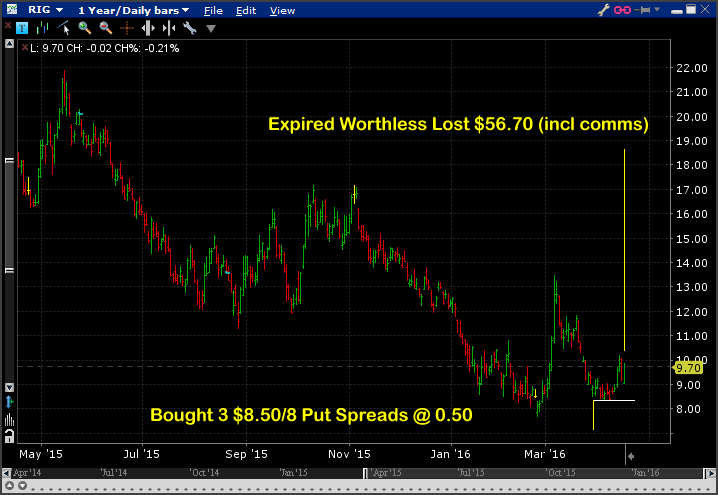
RIG saw the $8.50 puts trade 20k over 6k in open interest on the 30th so I bought the $8.50/$8 puts spread.
Looked like a great trade, see how close it was to the breakeven in the chart? It wasn't to be, the stock made some sideways movements and edged higher to close at a level making the spread worthless at expiration. I only lost $56 though.
VZ Long Call 30th March
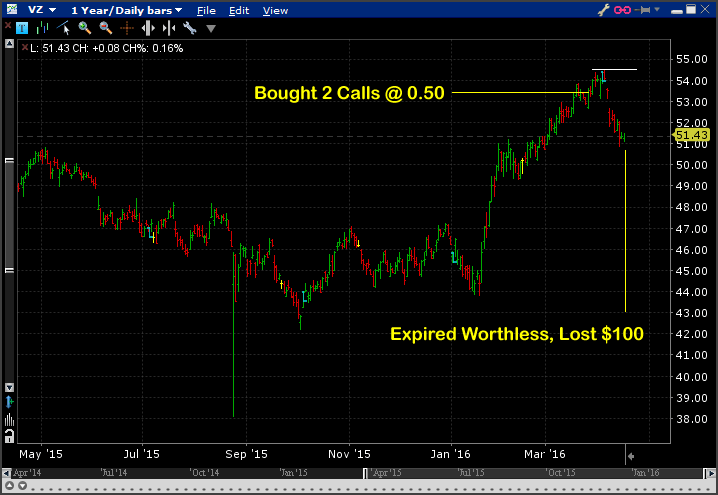
Ah, bought 2 calls on Verizon, not sure where this idea came from to be honest, now that I am writing about it. It wasn't from the Option Scanner. Anywyay, took a punt on this one but the stock tanked as you can see - total loss $100.
Feel free to leave a comment/question on the above and I'll get back to you as soon as I can.
0 Comments
No comments yet — be the first!
Add a Comment