Trade 1 - 27th December 2004 (Closed)
Last updated 21st January 2005
Strategy: Long Straddle
Underlying: Microsoft
Closed Position as at 21st January 2005
Long 1 January $27 Call Option @ 0.30. Expired worthless.
Long 1 January $27 Put Option @ 0.45. Closed at 1.35.
Net profit of $60 per option spread (80% ROI).
Background and Trade Setup
In this real-time example we are going to take a look at Microsoft stock and see if we can find any option trading opportunities.
One of the things we can look at is how the Microsoft has been trading recently and try to guage the current market sentiment. The first thing we notice is that MSFT has taken a small dip in price and has been range trading for about a month now. It also appears that the daily price changes have been calming down - or that the volatility is decreasing.
To be sure about the volatility, let's calculate the historical volatility for MSFT.
Note: I use TradeStation 2000i for my charting/indicators, but if you do not have a charting application that plots historical volatility, you can use my spreadsheet example, which has MSFT data included (adjusted for splits and dividends). I get all my data from Yahoo! by using the MLDownloader application.
If you don't have access to historical data, then I suggest MLDownloader from Trading-Tools. For a one time fee of $79.95 you'll get complete stock data history from over 100 stock exchanges. The program will also perform daily updates and will back adjust the historical data for stock splits and dividends. It's unbelievable value for money for considering what else is out there...for example, take a look at CSI - they will charge you $500 every year you use the product for the same data MLDownloader provides for a one off fee $79.95. Take a look at this small screen shot to get an idea of the interface.
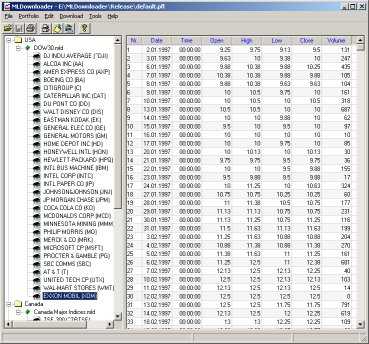
For a free trial or to buy MLD, go to Share-It.
Anyway, in the above graph you can see that I have calculated three volatility figures: a 30 day, 50 day and 100 day.
Yes, we can now see that volatility has indeed been decreasing recently as the 30 is less than the 50 and the 50 is less than the 100 day volatility levels.
Now, what type of movement is likely given the current facts? I would say to expect volatility to increase and for MSFT share price to move more rapidly than it has done recently. Which way? It doesn't matter because we are going to implement a Long Straddle.
Remember: A Long Straddle takes a neutral view on market direction. You can make money if the market goes up or down. The catch with straddles is that you need a very large move in either direction to make money. Let's take a look and see.
The closest strike price is for $27. Today, on the 27th December, the MSFT 27 calls are trading at 0.30 and the 27 put options are trading at 0.45. So, imagine we tell our broker the following:
Buy 1 January $27 Call option and also Buy 1 January $27 Put option and to pay no more than $0.75 for the spread. So, our position is:
Long 1 January $27 Call Option @ 0.30
Long 1 January $27 Put Option @ 0.45
Remember the option's contract size though. US stock options represent 100 shares per every option contract. When you are filled the trade will cost you $75 in total per spread (0.75 * 100).
Now, MSFT closed at 26.85 and we have bought a $27 Straddle for $0.75. So, we need to make more than $0.75 for our trade to be profitable. That means that MSFT has to either rally or sell off by more than $0.75 relative to our strike price before January 21st 2005 for us to make money from this trade.
Therefore our break even points for MSFT become 26.25 and 27.75 (27 +/- 0.75).
MSFT has to be trading higher than 27.75 or lower than 26.25 at or before the 21st January for this strategy to be profitable. Remember though, that if the option strategy suddenly becomes profitable due to a large move in the Microsoft share price before expiry we can still make money be selling back the straddle at a profit. Let's take a look at the updated MSFT graph with our break even points inserted.
In the graph above I have included our upper break even limit of 27.75 and our lower break even limit of 26.25. Let's see how it goes.
Update 6th January 2005
MSFT is now trading at $26.75. The price is still within our break even points, so it is not a profitable trade yet. In other words it has no intrinsic value.
The $27 call is trading at 0.20 and the $27 put is trading at 0.40. So, the market value of our option spread is currently 0.60. We paid 0.75 for it, so our unrealized P&L is currently a loss of 0.15 or %20.
Notice the leverage here? MSFT has made a downward move of only 0.37% and the market value of our options position has changed by 20%. That's 54 times.
So, currently we are down 20% and still have 15 days to go.
Update 14th January 2005
Now we're looking good! MSFT closed at $26.12, which is just inside our lower break even point of $26.25. The 30 day underlying volatility has decreased 2.09 points to 9.10%, however, the implied volatility has increased substantially to 17.33% for the call option and 17.99% for the put option. The $27 call options closed at 0.05 and the $27 put options closed at 0.90.
This means that the market value for our option spread is now 0.95. We bought the spread for 0.75. So, we are now in-the-money 0.20 points, which is 26.67%.
Notice the underlying volatility, while still low, almost looks like it is starting to increase? Well, it looks like the rest of the market is thinking that too, which is why the option prices have increased leading to higher implied volatilities. In other words the market believes that there is now a good chance that MSFT's volatility will increase and lead to more rapid price changes.
Update 21st January 2005
It is now expiration and MSFT is trading outside our lower break even point of 26.25 to finish at 25.65 at the close of business, which means our strategy is now worth 1.35. How do we arrive at this value?
Because the stock closed below our strike price, the call option becomes worthless. Nobody would want to exercise an option to buy at $27 when the shares are actually trading at $25.65. However, the put option is now worth 1.35. An investor who owns $27 put options can exercise and sell Microsoft shares at $27 and then immediately buy them back at the exchange for $25.65. So, the call option is worth 0 and the put option is worth 1.35.
But we have to subtract from this what it cost us to enter into this trade i.e. the option premium paid for the spread, which is 0.75. In other words, we paid 0.75 for this option spread and it is now worth 1.35.
Well, we really paid $75 per spread and received $135 per spread due to the contract size of the options being 100.
So, we made a profit of $60 per option spread. More importantly we made 80% return on investment, because we made $60 on an outlay of $75.
To further illustrate the effect of leverage in option trading, consider this...in 24 days MSFT made a downward move of 4.47% yet we made an 80% return on investment in the same time period trading a simple option strategy.
Here is the chart of Microsoft at the end of the option strategy.
9 Comments
Peter October 3rd, 2014 at 8:10am
M A Raman, yes, that's true and a fair point to think about when taking on long positions; you always need to think about the decay of the option value relative to the movement you expect it to make due to market movements.
M A Raman October 2nd, 2014 at 7:16am
What about Value of Theta? Wont the premium will sharply reduced once the expiry period is approaching!!!
Peter January 7th, 2013 at 9:14pm
Hi Zais,
Yes, you can exit a portion of the position and hold the remainder until expiration.
Zais January 7th, 2013 at 8:50pm
I just discovered this site...a nice educational resource... with the above Trade...I have a question if Peter or anyone can answer please...
Can a trader sell one option that is part of the straddle and keep the other before expiration? Thanks...
Peter November 24th, 2010 at 4:26pm
Yep, fair point. Then you'd have to sell out of the position to make the profit...I was of course intending for the trade to carry until expiration.
K November 24th, 2010 at 11:17am
Hello Peter,
The above statement, "MSFT has to be trading higher than 27.75 or lower than 26.25 at or before the 21st January for this strategy to be profitable" is not true.
The implied vol could increase while the price action stays relatively stable, thereby increasing the value our position above 0.75. If we held the position until expiration, then yes, it would have to be higher than 27.75 or lower than 26.25 in order to be profitable.
Regards,
K
Peter August 22nd, 2010 at 7:37am
Hi Ahmed, you can download it here;
Historical Volatility ELS
ahmed turtle August 21st, 2010 at 2:11am
in trade station i couldnt find historical volatility indicator, i found the volatility indicator, can u pls suggest where to fin it in trade station
Larry May 28th, 2010 at 8:22am
Well explained. TQ
Add a Comment