Trade 2 - 7th April 2005 (Closed)
Strategy: Time Spread
Underlying: US Dollar Futures
Closed Position as at 6th May 2005
Bought 1 May 82 Put @ 0.07 - expired worthless - loss of 0.07
Sold 1 September 82 Put @ 0.85 - now trading at 0.64 - a profit of 0.21
Bought 1 May 88 Call @ 0.03 - expired worthless - loss of 0.03
Sold 1 September 88 Call @ 0.66 - now trading at 0.52 - a profit of 0.14
Net profit of 25 points per spread.
Background and Trade Setup
I subscribed to a free report on options trading at Delta Neutral Trading (link removed as site no longer active) and received an email from the author today. David Rivera sends out an email every so often with a recommendation of an option strategy.
David has a unique way of looking at Time Spreads. Traditional option theory suggests that you sell options that are closer to expiration and buy options that are further away from expiration. This is to take advantage of the fact that options are a decaying asset and therefore lose value as each day passes. As expiration approaches the likely hood that the stock will increase or decrease above or below the strike price decreases each day.
However, David at Delta Neutral Trading says that the best options to sell are those that have a higher "cost per day" value. Here is what he says in his email that I received today:
I was doing my search for option inconsistencies and here is what I found.
I am looking at how much an option costs per day compared to an option from a different month in the same futures market.
June U.S. Dollar futures contract closed at 84.78 (May options follow the June Futures contract).
Sep. U.S. Dollar futures contract closed at 84.69.
May U.S. Dollar options have 32 days left until expiration.
Sep. U.S. Dollar options have 158 days left until expiration.
May U.S. Dollar 88 Call options settled at .05.
Sep. U.S. Dollar 88 Call options settled at .66.
The Sep. 88 Call is 13.2 times more expensive than the May 88 Call, but it ONLY has 4.9 times more time left.
May U.S. Dollar 82 Put options settled at .06.
Sep. U.S. Dollar 82 Put options settled at .75.
The Sep. 82 Put is 12.5 times more expensive than the May 82 Put, but it ONLY has 4.9 times more time left.
When putting on any calendar spread, buy the cheaper cost per day options and sell the more expensive.
Even if you are not putting on a spread, this is a great way to choose which option to buy or sell.
So, let's have a look at this trade.
Seeing as Yahoo does not support futures data/charts, I will use FutureSource for the charts and quotes. FutureSource is also a free service.
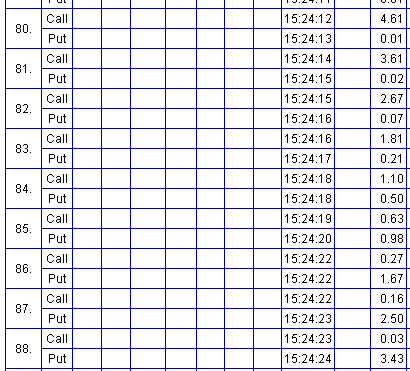
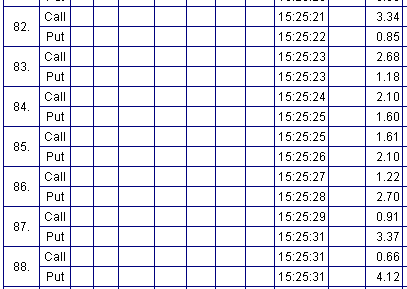
As of this writing (6 th April 2005) here is a snapshot of the closing prices of the US Dollar Futures May option series. By the time I checked my Hotmail account, the prices have changed a little, so the prices that we will use for this trade example are prices as at the time of writing.
US Dollar May 2005 Options.
US Dollar September 2005 Options.
Let's put on these two trades at the current market prices and see how they perform.
We will out on two calendar spreads, which will involve four legs: a May/Sep 82 Put Time Spread and a May/Sep 88 Call Time Spread.
Going from today's prices the May/Sep 82 Put spread will look like this:
Buy 1 May 82 Put option for 0.07
Sell 1 September 82 Put for 0.85
For this spread you receive a net credit of 0.78.
The May/Sep 88 Call spread will look like this:
Buy 1 May 88 Call option for 0.03
Sell 1 September 88 Call option for 0.66
Again a net credit of 0.64.
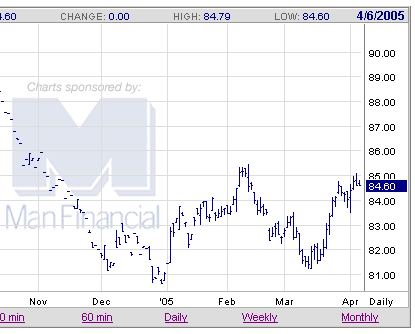
Here is a chart of the front month US Dollar futures contract.
Update April 8th 2005
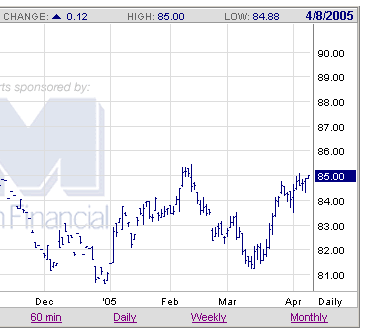
2 days have passed since we put on this trade and we now have the June US Dollar futures contract trading at 85.
Here is a summary of our two spreads:
Bought 1 May 82 Put @ 0.07 - now trading at 0.04
Sold 1 September 82 Put @ 0.85 - now trading at 0.74
Bought 1 May 88 Call @ 0.03 - now trading at 0.04
Sold 1 September 88 Call @ 0.66 - now trading at 0.69
So far we have made 6 points on this trade in two days and we still have 29 days until expiration.
What we want is really for the market to increase in volatility and price so that the front month options increase in value faster than the back month options.
Update April 15th 2005
9 days have now passed since we put on this trade and we now have the June US Dollar futures contract trading at 84.50.
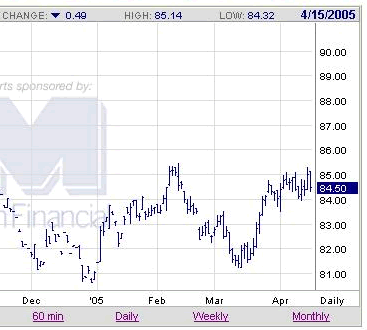
Here is a summary of our two spreads:
Bought 1 May 82 Put @ 0.07 - now trading at 0.04
Sold 1 September 82 Put @ 0.85 - now trading at 0.79
Bought 1 May 88 Call @ 0.03 - now trading at 0.01
Sold 1 September 88 Call @ 0.66 - now trading at 0.54
We are now up 13 points on this trade and still have 19 days until the May options expire.
Update April 22nd 2005
16 days have now passed and the June Dollar Futures contract is trading at 83.45.
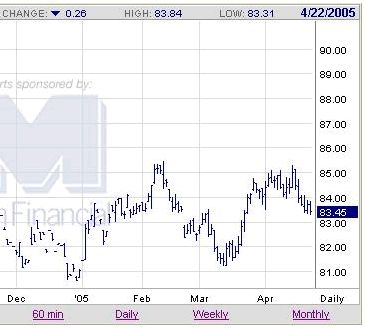
Here is a summary of our two option spreads:
Bought 1 May 82 Put @ 0.07 - now trading at 0.09
Sold 1 September 82 Put @ 0.85 - now trading at 1.11
Bought 1 May 88 Call @ 0.03 - now trading at 0.01
Sold 1 September 88 Call @ 0.66 - now trading at 0.38
The strategy has now come in 11 points and eroded away our profits a little. So we are now only making 0.02 points per spread.
Update April 29th 2005
23 days have now passed and the June US Dollar Futures contract is trading at 84.42.
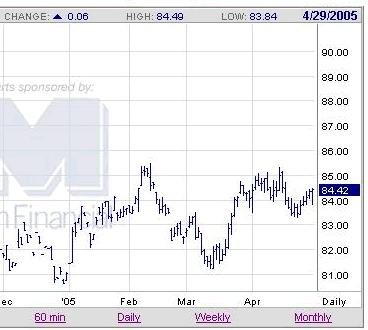
Here is a summary of our two option spreads:
Bought 1 May 82 Put @ 0.07 - now trading at 0.01
Sold 1 September 82 Put @ 0.85 - now trading at 0.80
Bought 1 May 88 Call @ 0.03 - now trading at 0.01
Sold 1 September 88 Call @ 0.66 - now trading at 0.57
The position has come back a little in our favour and we are now making 0.06 points per spread and have five days left to make some more money off this trade.
Update May 3rd 2005
There are now only 3 days left until expiration and the Junr US Dollar Futures contract is trading at 84.46.
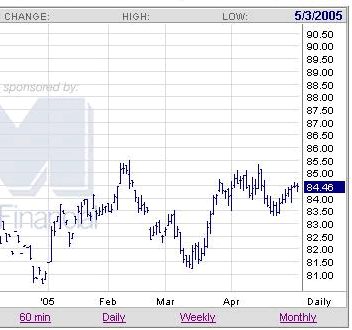
Here is a summary of our two option spreads:
Bought 1 May 82 Put @ 0.07 - now trading at 0.01
Sold 1 September 82 Put @ 0.85 - now trading at 0.80
Bought 1 May 88 Call @ 0.03 - now trading at 0.01
Sold 1 September 88 Call @ 0.66 - now trading at 0.57
Update May 6th 2005
May options have now expired. It's the day after expiration (Friday) and the June US Dollar Futures contract is trading at 84.62.
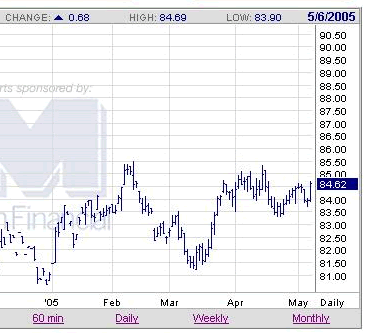
Both of our short May options expired worthless, which means we loose the premium paid. But, we are also short (we sold) the far dated options. Let's see how they have performed:
Bought 1 May 82 Put @ 0.07 - expired worthless - loss of 0.07
Sold 1 September 82 Put @ 0.85 - now trading at 0.64 - a profit of 0.21
Bought 1 May 88 Call @ 0.03 - expired worthless - loss of 0.03
Sold 1 September 88 Call @ 0.66 - now trading at 0.52 - a profit of 0.14
So, all in all we made a tidy little profit of 0.25 points per spread. Not bad off some advice from a free newsletter.
PeterNovember 10th, 2009 at 4:13am
Yep, you're right about the May/Sep typo JC...thanks for pointing that out!
However, the profit of 6 points on August is correct;
May 82 Put = -0.03
Sep 82 Put = +0.11
May 88 Call = +0.01
Sep 88 Call = -0.03
JCNovember 9th, 2009 at 7:11am
I think you have a typo.
You state:-
Sell 1 May 88 Call option for 0.66
Again a net credit of 0.64
when I think you mean :-
Sell 1 Sept 88 Call option for 0.66
Again a net credit of 0.64
Also the profit on 8th April should be 4 points, not 6
The article also repeatedly uses xx profit per spread, when really the profit is for the strategy, which has two spreads.
Got to say this is a fantastic site though! Many thanks
Add a Comment