Trade Idea: NIFTY (NSE) Index Options
Update 24th February, 2012
Unfortunately, the position was not successful - the index closed at 5477.50, which was 2.8% above the upper breakeven level of 5329. The net loss of the trade was 3,550 INR per contract.
| Position | Type | Strike | Price | Payoff | P&L |
| -1 |
Call |
5300 |
27.50 |
-177.50 |
-7500 |
| +1 |
Call |
5400 |
14.50 |
77.50 |
3,150 |
| -1 |
Put |
4700 |
45.00 |
0 |
2,250 |
| +1 |
Put |
4600 |
29.00 |
0 |
-1,450 |
| Total P&L |
-3,550 INR |
Update 23rd February, 2012
| Position | Type | Strike | Price | Current | P&L |
| -1 |
Call |
5300 |
27.50 |
216.25 |
-9,437.50 |
| +1 |
Call |
5400 |
14.50 |
120.00 |
5,275 |
| -1 |
Put |
4700 |
45.00 |
0.30 |
2,235 |
| +1 |
Put |
4600 |
29.00 |
0.30 |
-1,435 |
| Total P&L |
-3,362.50 INR |
Update 20th February, 2012
| Position | Type | Strike | Price | Current | P&L |
| -1 |
Call |
5300 |
27.50 |
298.00 |
-13,525 |
| +1 |
Call |
5400 |
14.50 |
199.75 |
9,262.50 |
| -1 |
Put |
4700 |
45.00 |
0.75 |
2,212.50 |
| +1 |
Put |
4600 |
29.00 |
0.70 |
-1,415.00 |
| Total P&L |
-3,465.00 INR |
Update 17th February, 2012
| Position | Type | Strike | Price | Current | P&L |
| -1 |
Call |
5300 |
27.50 |
235.00 |
-10,375 |
| +1 |
Call |
5400 |
14.50 |
143.50 |
6,450 |
| -1 |
Put |
4700 |
45.00 |
0.70 |
2,215 |
| +1 |
Put |
4600 |
29.00 |
0.75 |
-1,412.50 |
| Total P&L |
-3,122.50 INR |
Update 16th February, 2012
| Position | Type | Strike | Price | Current | P&L |
| -1 |
Call |
5300 |
27.50 |
252.00 |
-11,225 |
| +1 |
Call |
5400 |
14.50 |
159.00 |
7,225 |
| -1 |
Put |
4700 |
45.00 |
0.75 |
2,212.50 |
| +1 |
Put |
4600 |
29.00 |
0.75 |
-1,412.50 |
| Total P&L |
-3,200.00 INR |
Update 15th February, 2012
| Position | Type | Strike | Price | Current | P&L |
| -1 |
Call |
5300 |
27.50 |
166.20 |
-6,935 |
| +1 |
Call |
5400 |
14.50 |
89.90 |
3,770 |
| -1 |
Put |
4700 |
45.00 |
0.80 |
2,210 |
| +1 |
Put |
4600 |
29.00 |
0.75 |
-1,412.50 |
| Total P&L |
-2,367.50 INR |
Update 13th February, 2012
| Position | Type | Strike | Price | Current | P&L |
| -1 |
Call |
5300 |
27.50 |
139.20 |
-5,585 |
| +1 |
Call |
5400 |
14.50 |
78.65 |
3,207.50 |
| -1 |
Put |
4700 |
45.00 |
1.75 |
2,162.50 |
| +1 |
Put |
4600 |
29.00 |
1.45 |
-1,377.50 |
| Total P&L |
-1,592.50 INR |
Update 10th February, 2012
| Position | Type | Strike | Price | Current | P&L |
| -1 |
Call |
5300 |
27.50 |
181.00 |
-7,675 |
| +1 |
Call |
5400 |
14.50 |
110.00 |
4,775 |
| -1 |
Put |
4700 |
45.00 |
1.65 |
2,167.50 |
| +1 |
Put |
4600 |
29.00 |
1.35 |
-1,382.50 |
| Total P&L |
-2,115.00 INR |
Update 9th February, 2012
| Position | Type | Strike | Price | Current | P&L |
| -1 |
Call |
5300 |
27.50 |
147.85 |
-6,017.50 |
| +1 |
Call |
5400 |
14.50 |
88.25 |
3,687.50 |
| -1 |
Put |
4700 |
45.00 |
2.70 |
2,115 |
| +1 |
Put |
4600 |
29.00 |
2.00 |
-1,350 |
| Total P&L |
-1,565.00 INR |
Update 8th February, 2012
| Position | Type | Strike | Price | Current | P&L |
| -1 |
Call |
5300 |
27.50 |
129.80 |
-5,115 |
| +1 |
Call |
5400 |
14.50 |
76.00 |
3,075 |
| -1 |
Put |
4700 |
45.00 |
4.10 |
2,045 |
| +1 |
Put |
4600 |
29.00 |
3.00 |
-1,300 |
| Total P&L |
-1,295.00 INR |
Update 7th February, 2012
| Position | Type | Strike | Price | Current | P&L |
| -1 |
Call |
5300 |
27.50 |
136.00 |
-5,425 |
| +1 |
Call |
5400 |
14.50 |
80.50 |
3,300 |
| -1 |
Put |
4700 |
45.00 |
5.15 |
1,992.50 |
| +1 |
Put |
4600 |
29.00 |
3.40 |
-1,280 |
| Total P&L |
-1,412.50 INR |
Update 6th February, 2012
| Position | Type | Strike | Price | Current | P&L |
| -1 |
Call |
5300 |
27.50 |
129.25 |
-5,087.50 |
| +1 |
Call |
5400 |
14.50 |
76.40 |
3,095 |
| -1 |
Put |
4700 |
45.00 |
6.00 |
1,950 |
| +1 |
Put |
4600 |
29.00 |
4.30 |
-1,235 |
| Total P&L |
-1,277.50 INR |
Update 3rd February, 2012
| Position | Type | Strike | Price | Current | P&L |
| -1 |
Call |
5300 |
27.50 |
92.00 |
-3,225 |
| +1 |
Call |
5400 |
14.50 |
50.00 |
1,775 |
| -1 |
Put |
4700 |
45.00 |
8.50 |
1,825 |
| +1 |
Put |
4600 |
29.00 |
5.55 |
-1,172.50 |
| Total P&L |
-797.50 INR |
Update 2nd February, 2012
| Position | Type | Strike | Price | Current | P&L |
| -1 |
Call |
5300 |
27.50 |
87.95 |
-3,022.50 |
| +1 |
Call |
5400 |
14.50 |
48.00 |
1,675 |
| -1 |
Put |
4700 |
45.00 |
7.00 |
1,900 |
| +1 |
Put |
4600 |
29.00 |
4.65 |
-1,217.50 |
| Total P&L |
-665.00 INR |
Update 1st February, 2012
| Position | Type | Strike | Price | Current | P&L |
| -1 |
Call |
5300 |
27.50 |
72.15 |
-2,232.50 |
| +1 |
Call |
5400 |
14.50 |
38.00 |
1,175 |
| -1 |
Put |
4700 |
45.00 |
7.65 |
1,867.50 |
| +1 |
Put |
4600 |
29.00 |
5.20 |
-1,190 |
| Total P&L |
-380.00 INR |
Update 30th January (close), 2012
| Position | Type | Strike | Price | Current | P&L |
| -1 |
Call |
5300 |
27.50 |
36.95 |
-472.50 |
| +1 |
Call |
5400 |
14.50 |
18.50 |
200 |
| -1 |
Put |
4700 |
45.00 |
15.50 |
1,475 |
| +1 |
Put |
4600 |
29.00 |
9.60 |
-970 |
| Total P&L |
+232.50 INR |
Update 30th January, 2012
| Position | Type | Strike | Price | Current | P&L |
| -1 |
Call |
5300 |
27.50 |
70.10 |
-2,130 |
| +1 |
Call |
5400 |
14.50 |
37.50 |
1,150 |
| -1 |
Put |
4700 |
45.00 |
9.10 |
1,795 |
| +1 |
Put |
4600 |
29.00 |
5.65 |
-1,167.50 |
| Total P&L |
-352.50 INR |
Update 27th January, 2012
| Position | Type | Strike | Price | Current | P&L |
| -1 |
Call |
5300 |
27.50 |
55.95 |
-1,422.50 |
| +1 |
Call |
5400 |
14.50 |
28.50 |
700 |
| -1 |
Put |
4700 |
45.00 |
13.35 |
1,582.50 |
| +1 |
Put |
4600 |
29.00 |
8.60 |
-1,020 |
| Total P&L |
-160 INR |
Update 25th January, 2012
| Position | Type | Strike | Price | Current | P&L |
| -1 |
Call |
5300 |
27.50 |
45.80 |
-915 |
| +1 |
Call |
5400 |
14.50 |
23.00 |
425 |
| -1 |
Put |
4700 |
45.00 |
17.60 |
1370 |
| +1 |
Put |
4600 |
29.00 |
11.25 |
-887.50 |
| Total P&L |
-7.50 INR |
Update 24th January, 2012
| Position | Type | Strike | Price | Current | P&L |
| -1 |
Call |
5300 |
27.50 |
38.75 |
-562.50 |
| +1 |
Call |
5400 |
14.50 |
19.40 |
245 |
| -1 |
Put |
4700 |
45.00 |
24.20 |
1040 |
| +1 |
Put |
4600 |
29.00 |
14.80 |
-710 |
| Total P&L |
+12.50 INR |
Update 20th January, 2012
| Position | Type | Strike | Price | Current | P&L |
| -1 |
Call |
5300 |
27.50 |
30.00 |
-125 |
| +1 |
Call |
5400 |
14.50 |
14.85 |
17.50 |
| -1 |
Put |
4700 |
45.00 |
31.95 |
652.50 |
| +1 |
Put |
4600 |
29.00 |
20.00 |
-450.00 |
| Total P&L |
+95.00 |
The index posted a small rally yesterday and our position is still showing a small profit of 95 INR. This is due to a decrease in implied volatility, which helps a position like this.

18th January, 2012
I've been looking for an opportunity to test out one of the trading strategies I watched in the TradingOlogy videos and think that the NIFTY index is a great candidate for an Iron Condor strategy.
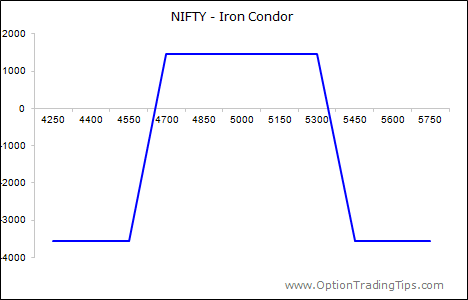
A long Iron Condor is a 4 legged option strategy that looks like a Long Butterfly except the center strike is split into two separate strikes creating a wider profit area.
You can also look at an Iron Condor as two Vertical Spreads: a short upside call spread and short downside put spread. Here are all 4 legs of this trade put together;
NIFTY: Long Iron Condor
-1 5300 Call @ 27.50
+1 5400 Call @ 14.50
-1 4700 Put @ 45.00
+1 4600 Put @ 29.00
Due to the trading restrictions on foreigners in India I cannot actually execute this trade with real money via my own brokerage account so this will just be a paper trade that I will monitor over the coming weeks. But if I were to trade this at the above prices it would result in a net credit into my account of 1,450 INR (Indian Rupees) as the Multiplier of the NIFTY is 50 INR. The max loss if the trade goes against me will be 3,550 INR. Here's the payoff Graph;

Max Profit = 1,450
Max Loss = 3,550
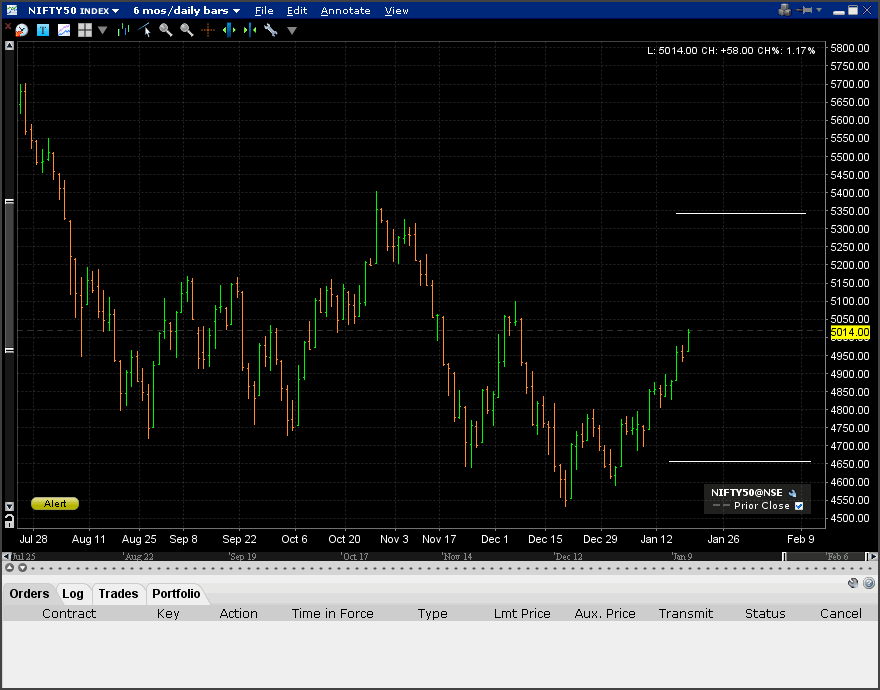
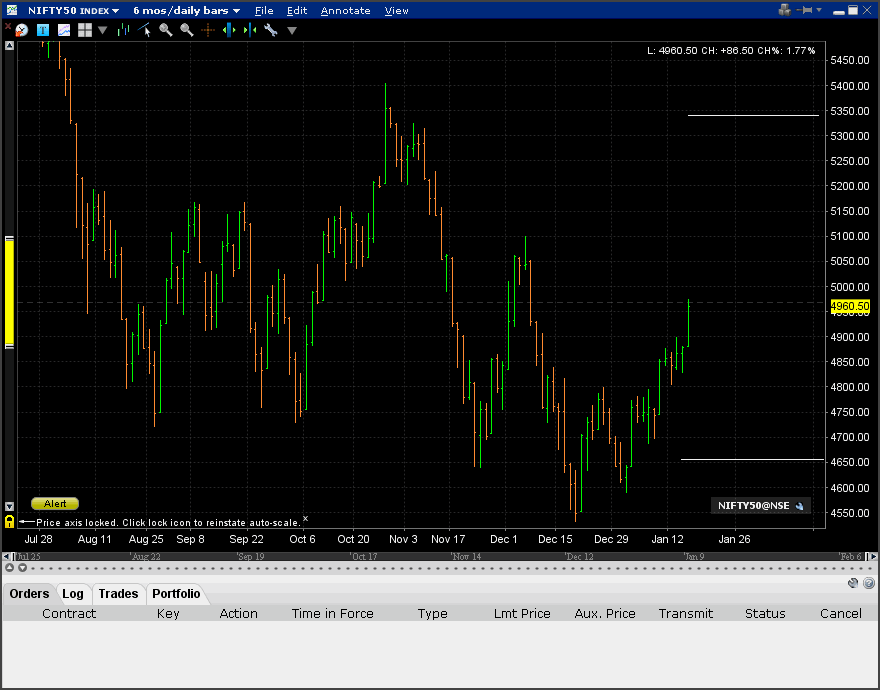
The break even points are 4,656.50 (-7%) and 5,343.50 (+7%). This means that the market needs to stay in a 14% range over the next 36 days in order for the trade to remain profitable. Here is a graph of the NIFTY index;

The two horizontal lines represent the profitable area i.e. as long as the market remains in this trading range the strategy will be profitable.
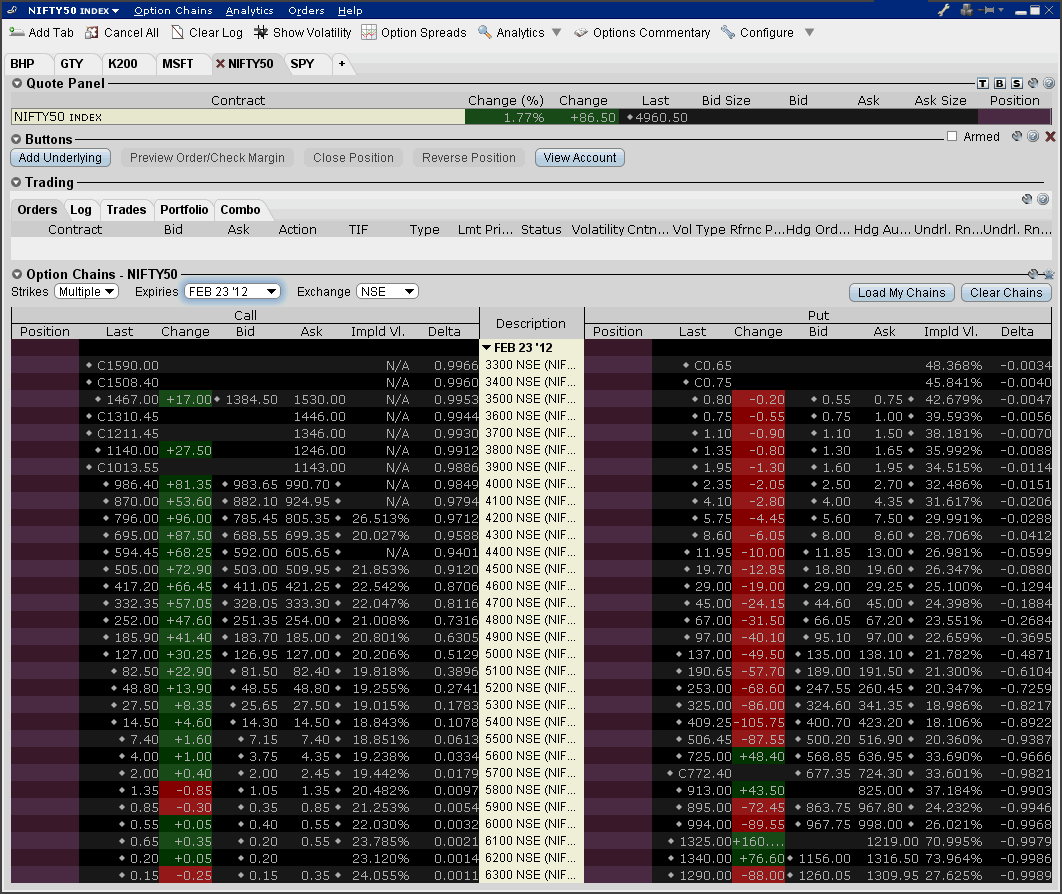
Here is a screen shot of my trading screen where I took the option prices from;

I'll continue to update the trade every few days to keep you posted of its' results. If you don't want to keep coming back to the site to check, you can subscribe to updates for free via the following;
 Email Newsletter
 FaceBook Page
 Twitter Feed
 RSS Feed


PeterOctober 29th, 2012 at 4:25am
Hi Nitin,
Do you mean in relation to options for stock? It is also called the Multiplier or Contract Size and refers to the number of shares that each option converts to.
Typically this number is 100 - so for example, if you buy one call option you have the right to exercise that option into 100 shares of the underlying stock.
nitinOctober 27th, 2012 at 8:54am
tell me about stock ratio
PeterAugust 29th, 2012 at 7:59pm
Hi Kumar,
These screen shots are taken from my online trading terminal that my broker, Interactive Brokers, provides me.
KumarAugust 29th, 2012 at 5:24am
Hi,
what software are you using to see options chain for Nifty. I can see the option chain this page however I am unable to make out the software name
thanks
PeterJanuary 18th, 2012 at 6:24pm
Hi bb, I usually look to sell the leg of the option that has a delta of 20% (-20% for puts). So, for the SPX the strikes based off yesterdays prices would be;
-1 1355 Call
+1 1360 Call
-1 1240 Put
+1 1235 Put
Approximately 8% buffer.
I use Interactive Brokers and currently no implied volatility data is showing for the FTSE 100 so I cannot comment on that. I'll look again this afternoon when the market has opened and let you know.
bbJanuary 18th, 2012 at 3:28am
Hi Peter,
What range will you pick if you are trading on ftse 100 index optons and spx index options?
I just want to see if this work on s and p and ftse
Thanks,
bb
Add a Comment