Put Backspread - Anheuser-Busch
Page 1 | Page 2
Date: Friday, 9 th march 2007
Strategy: Put Backspread
Underlying: Anheuser-Busch (NYSE:BUD)
Background and trade setup
I want to give STSUSA another go at picking a winning move. The last trade didn't turn out too good with the market taking a dive on the back of some action in China. That and a bad choice of option trade were a little costly.
This next pick from Stock Trading Systems USA is a short position alert. The stock is Anheuser-Busch, which trades on the NYSE.
March options expire next week on the 16th . Seeing as though STSUSA is picking a downward move, I want to choose a bearish option spread. Because I will be buying options and hence long a spread, I won't trade the March options due to the adverse effects of time decay so close to expiration. After my last trade, I think it will be wise to cover both sides of the market, just in case the stock trades higher.
I bought a cool utility called Visual Options Analyzer. Cost about USD 75. I can download option quotes across a bunch of exchanges for free and save them to a file for analysis later. It allows me to quickly toggle through various option positions so I can price up how much each one will cost. It has 2 and 3D graphs of the payoffs too.
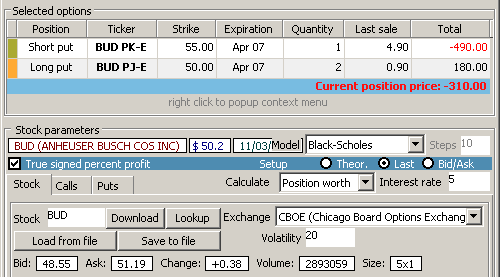
After playing around with a few different setups, I settled on a put backspread. Here are the option prices:

Source: VOptions
In total, I receive $310 per option spread to put on the trade. Even though I receive money upfront for this position (therefore a credit spread), I still consider the strategy long as I want the market to make a directional move to profit.
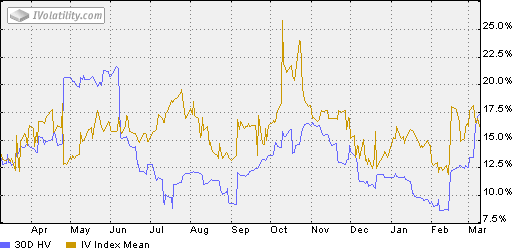
I took a quick look at the implied volatility of the stock too, and it seems that the options are trading around fair value - the prices implied by the options are around the same volatility as shown historically by the stock.
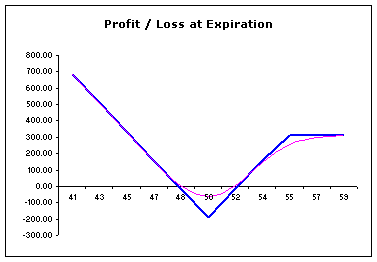
With this trade setup I win both ways: if the stock trades lower my profit potential is unlimited. If it continues to trade higher, I can still profit, only my gains are limited on the upside to $310.
Here's the payoff chart I generated with my option pricing spreadsheet:

It also tells me my breakeven points, which are when the stock trades lower than $48.10 and higher than $51.90.
Let's see how it unfolds. >> Next


There are zero comments
Add a Comment