Option Portfolio
Market Close January 19, 2017
P&L up $3
| Symbol | Position | Price | Close | P&L |
|---|---|---|---|---|
| GLW Short Iron Condor | ||||
| GLW Feb17'17 $25 Call | -3 | 0.48 | 0.47 | 3 |
| GLW Feb17'17 $26 Call | 3 | 0.2 | 0.16 | -12 |
| GLW Feb17'17 $23 Put | -3 | 0.23 | 0.26 | -9 |
| GLW Feb17'17 $22 Put | 3 | 0.13 | 0.2 | 21 |
| Total | -1.14 | -1.11 | 3 | |
| Grand Total | 3 |
How to Adjust a Losing Iron Condor?
January 25th, 2017
Looks like my pre-earnings Iron Condor strategy was indeed a bad idea. GLW released their earnings before the market opened Tuesday 24th January to the surprise of analysts.
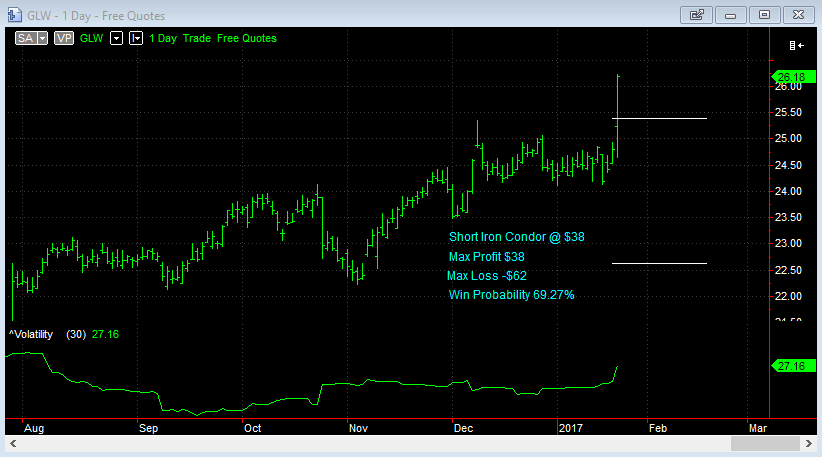
Core EPS turned out to be $0.50 on a predicted $0.44. The stock opened strong and rallied higher throughout the day to close the session up 5.7% to $26.18.
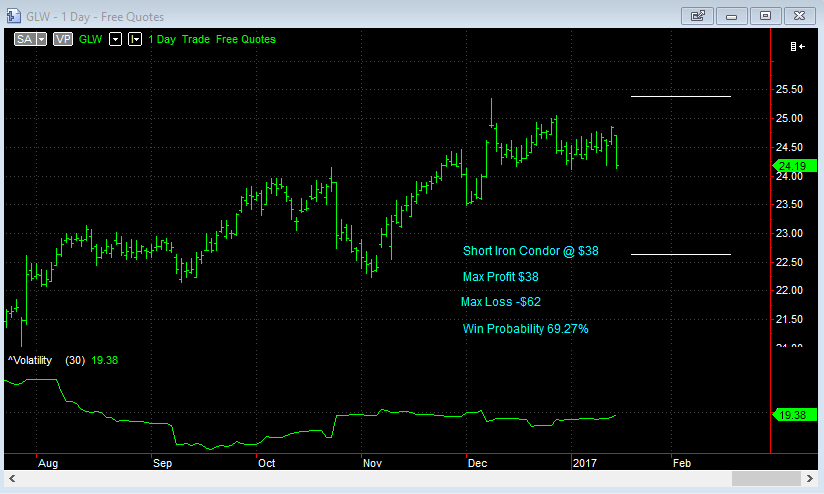
The stock is now outside the upper breakeven point of $25.38 and if it continues I will realise my max loss of $186 ($62 per contract).
What Options do I have to Adjust?
I have a few alternatives to consider as to how to manage this trade at this point:
- Do nothing and hope that the market pulls back from now until expiration
- Sell a higher strike put spread
- Sell a higher strike put spread in the next expiration
- Reverse the existing short call spread into a long call spread
- Close the short call and leave the long call to run
- Double down with another Iron Condor
In considering the above, I looked at the option prices at the close for the Feb 17th options:
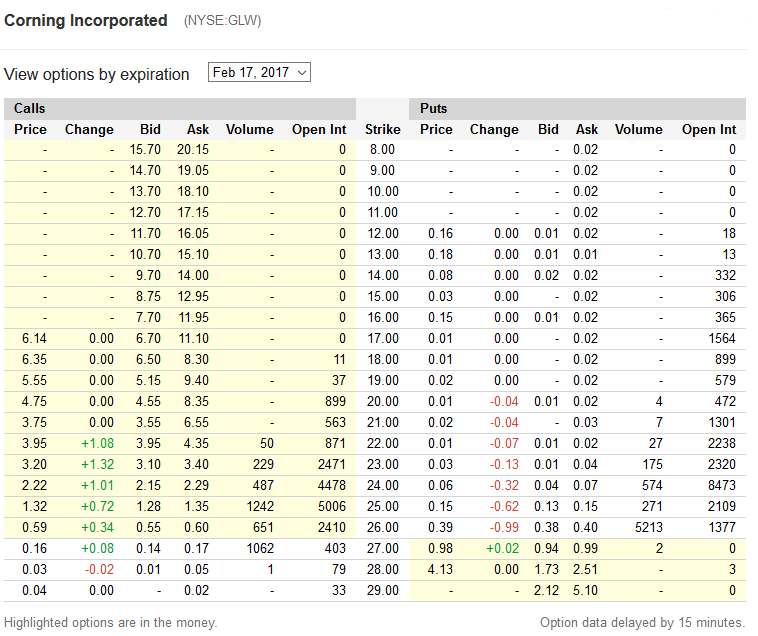
Since the pop in stock price due to earnings, the uncertainty has since been remove and can be seen in much lower option prices. Implied volatility has dropped to 18% so 2, 3 and 6 don’t look like bringing in much premium. Plus, putting on another Iron Condor in March would mean having to put it with narrow strikes in order to make it worthwhile but also means a lower chance of the stock staying between the bands.
Also to consider is the sentiment since the report, which was very favorable for the future outlook of the stock. I would say that I am now bullish on the stock.
Pre-market activity also shows a strong open with the stock having traded $26.30 with an hour before the open. So what I’m going to do is go with #5 above; close out the short $25 call and leave the $26 long call open. The $25 calls closed at $1.32 but with the pre-market looking to open higher, I’m not sure what price to go with. Perhaps yesterday’s offer price of $1.35?
Iron Condor Pre-Earnings
January 19th, 2017
It's not always a good idea to take on short volatility strategies pre-earnings, but take a look at this Iron Condor setup for GLW.
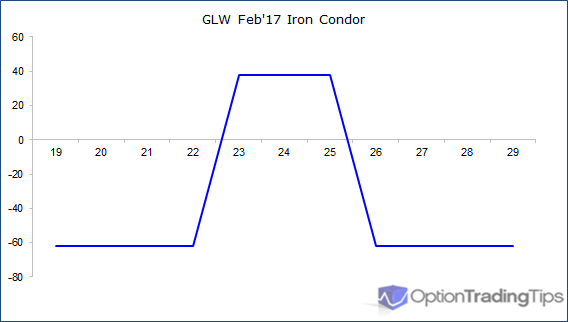
| B/S | Strike | C/P | Price |
|---|---|---|---|
| Sell | $25 | Call | 0.48 |
| Buy | $26 | Call | 0.20 |
| Sell | $23 | Put | 0.23 |
| Buy | $22 | Put | 0.13 |
| Total Credit | $38 | ||
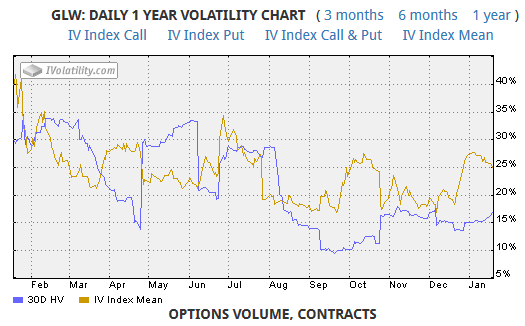
The stock has earnings out January 24th and the options expire February 17th. The implied volatility suggests there is some uncertainty leading into the announcement; IV is relatively high at 25% compared to historical vol of 15%.
Max profit on this is $38 per contract, which is the net credit received at the time of trade. Max loss is $62. At the current volatility level, there is a 69.27% chance of success with this trade.
Long 5 $12.50 Call Options
Trade Start: 25th October
Description.
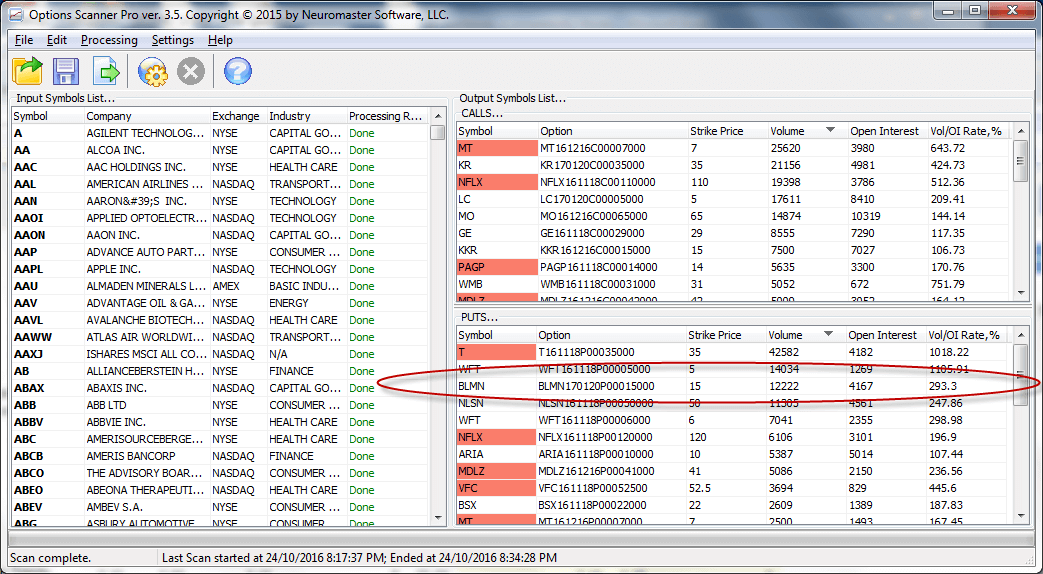
Option Scans for 24th October
Option Prices for 24th October
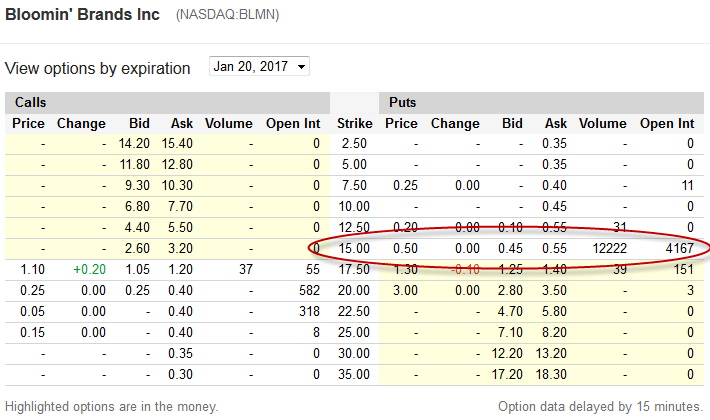
Long 5 $15 Put Options
Trade Start: 24th October, 2016
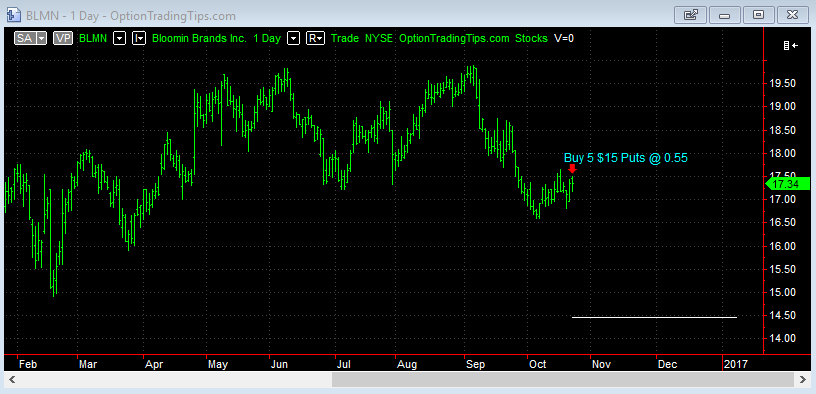
Only 0.55 for these puts when they are 3 months out. The chart doesn't make it look like a good trade but there's plenty of time in this one. Earnings are out October 28th.
Option Scans for 21st October
Option Prices for 21st October
2016 Closed Position Summary
| Trade | Open | Close | Days | P&L | Total |
|---|---|---|---|---|---|
| COH Iron Condor | 25-Jan-16 | 5-Feb-16 | 11 | 31.4 | 31.4 |
| COH Adj Call Spread | 3-Feb-16 | 5-Feb-16 | 2 | 55.5 | 86.9 |
| CAT Short Call Spread | 28-Jan-16 | 12-Feb-16 | 15 | -22.5 | 64.4 |
| COH Assignment | 8-Feb-16 | 12-Feb-16 | 4 | 74.6 | 139 |
| FCX Iron Butterfly | 28-Jan-16 | 18-Feb-16 | 21 | 35 | 174 |
| FSLR Iron Condor | 23-Feb-16 | 26-Feb-16 | 3 | -26.2 | 147.8 |
| TGT Short Call Spread | 23-Feb-16 | 26-Feb-16 | 3 | -66.6 | 81.2 |
| EPD Put Bear Spread | 29-Feb-16 | 18-Mar-16 | 18 | -40 | 41.2 |
| SPY Iron Condor | 2-Mar-16 | 4-Mar-16 | 2 | -22 | 19.2 |
| RCL Put Spread | 24-Mar-16 | 15-Apr-16 | 22 | -143.5 | -124.3 |
| MU Straddle | 30-Mar-16 | 1-Apr-16 | 2 | -50.6 | -174.9 |
| RIG Put Spread | 30-Mar-16 | 15-Apr-16 | 16 | -56.7 | -231.6 |
| VZ Long Call | 30-Mar-16 | 15-Apr-16 | 16 | -101.6 | -333.2 |
| JWN Long Put | 30-Mar-16 | 15-Apr-16 | 16 | 364.2 | 31 |
| C Straddle | 31-Mar-16 | 15-Apr-16 | 15 | 221.8 | 252.8 |
| EMC Long Put | 13-Apr-16 | 20-May-16 | 37 | -160 | 92.8 |
| ETE Long Call | 19-Apr-16 | 20-May-16 | 31 | 168 | 260.8 |
| MRO Long Call | 19-Apr-16 | 20-May-16 | 31 | -75 | 185.8 |
| KEY Long Call | 20-Apr-16 | 20-May-16 | 30 | 6 | 191.8 |
| MS Long Put | 20-Apr-16 | 20-May-16 | 30 | -100 | 91.8 |
| VALE Long Put | 21-Apr-16 | 20-May-16 | 29 | 360 | 451.8 |
| JNPR Long Put | 21-Apr-16 | 20-May-16 | 29 | -62 | 389.8 |
| KMI Long Call | 28-Apr-16 | 20-May-16 | 22 | -100 | 289.8 |
| IPHI Long Call | 29-Apr-16 | 20-May-16 | 21 | -55 | 234.8 |
| NG Long Call | 29-Apr-16 | 20-May-16 | 21 | -80 | 154.8 |
| MRO Short Call | 29-Apr-16 | 20-May-16 | 21 | 55 | 209.8 |
| CTL Long Put | 2-May-16 | 20-May-16 | 18 | 212 | 421.8 |
| HIMX Long Call | 9-May-16 | 13-May-16 | 4 | -55 | 366.8 |
| ETE Short Call | 10-May-16 | 20-May-16 | 10 | 55 | 421.8 |
| VIAV Long Call | 24-May-16 | 17-Jun-16 | 24 | -100 | 321.8 |
| CYH Long Strangle | 25-May-16 | 17-Jun-16 | 23 | -110 | 211.8 |
| HBI Long Strangle | 31-May-16 | 17-Jun-16 | 17 | -115 | 96.8 |
| ANF Long Put | 31-May-16 | 17-Jun-16 | 17 | -90 | 6.8 |
| RF Long Call | 1-Jun-16 | 17-Jun-16 | 16 | -80 | -73.2 |
| WLL Long Put | 8-Jun-16 | 24-Jun-16 | 16 | 300 | 226.8 |
| ANF Covered Put | 17-Jun-16 | 24-Jun-16 | 7 | 60 | 286.8 |
| ATVI Put Spread | 2-Jun-16 | 15-Jul-16 | 43 | -126 | 160.8 |
| CY Long Call | 2-Jun-16 | 15-Jul-16 | 43 | -42 | 118.8 |
| GOGO Long Put | 6-Jun-16 | 15-Jul-16 | 39 | -124 | -5.2 |
| VLO Long Put | 6-Jun-16 | 15-Jul-16 | 39 | -100 | -105.2 |
| RBS Long Call | 8-Jun-16 | 15-Jul-16 | 37 | -120 | -225.2 |
| PBI Long Call | 9-Jun-16 | 15-Jul-16 | 36 | -100 | -325.2 |
| GGAL Long Call | 9-Jun-16 | 15-Jul-16 | 36 | 60 | -265.2 |
| MT Long Call | 9-Jun-16 | 15-Jul-16 | 36 | -110 | -375.2 |
| PLD Long Call | 9-Jun-16 | 15-Jul-16 | 36 | 90 | -285.2 |
| VIAV Covered Call | 22-Jun-16 | 22-Jul-16 | 30 | 258 | -27.2 |
| BID Long Call | 11-Jul-16 | 9-Aug-16 | 29 | 1950 | 1922.8 |
| NLY Long Put | 8-Jul-16 | 19-Aug-16 | 42 | -90 | 1832.8 |
| LGF Long Put | 8-Jul-16 | 19-Aug-16 | 42 | -145 | 1687.8 |
| CMCSA Long Call | 11-Jul-16 | 19-Aug-16 | 39 | -100 | 1587.8 |
| D Long Put | 26-Jul-16 | 19-Aug-16 | 24 | -135 | 1452.8 |
| PEG Long Put | 27-Jul-16 | 19-Aug-16 | 23 | 140 | 1592.8 |
| KR Long Call | 27-Jul-16 | 19-Aug-16 | 23 | -150 | 1442.8 |
| DB Long Put | 11-Aug-16 | 16-Sep-16 | 36 | -150 | 1292.8 |
| LOW Long Put | 11-Aug-16 | 16-Sep-16 | 36 | 1050 | 2342.8 |
| FIT Long Call | 11-Aug-16 | 16-Sep-16 | 36 | -126 | 2216.8 |
| GT Long Call | 18-Aug-16 | 16-Sep-16 | 29 | 450 | 2666.8 |
| NUAN Long Put | 18-Aug-16 | 16-Sep-16 | 29 | -140 | 2526.8 |
| GFI Long Call | 13-Sep-16 | 21-Oct-16 | 38 | -170 | 2356.8 |
| EGO Long Call | 14-Sep-16 | 21-Oct-16 | 37 | -200 | 2156.8 |
| CCL Long Put | 19-Sep-16 | 21-Oct-16 | 32 | -120 | 2036.8 |
| BAC Long Butterfly | 27-Sep-16 | 21-Oct-16 | 24 | 105 | 2022.8 |
| DDD Long Put | 20-Sep-16 | 27-Oct-16 | 37 | -49 | 1987.8 |
| JCP Long Call Spread | 23-Sep-16 | 27-Oct-16 | 34 | -47 | 1940.8 |
| CNP Long Call | 26-Sep-16 | 27-Oct-16 | 31 | -150 | 1790.8 |
2015 Closed Position Summary
| Trade | Open | Close | Days | P&L | Total |
|---|---|---|---|---|---|
| BBY Short Put | 6-Jan-15 | 17-Jan-15 | 11 | 69 | 69 |
| F Long Call | 9-Jan-15 | 30-Jan-15 | 21 | -20 | 49 |
| AVP Calendar | 14-Jan-15 | 27-Feb-15 | 44 | -23 | 26 |
| AVP Put Spread | 14-Jan-15 | 27-Feb-15 | 44 | -32 | -6 |
| COH Short Condor | 15-Jan-15 | 30-Jan-15 | 15 | 81 | 75 |
| GRPN Buy-Write | 23-Jan-15 | 13-Feb-15 | 21 | -36 | 39 |
| WTW Short Put | 23-Jan-15 | 2-Mar-15 | 38 | -560 | -521 |
| CRUS Double Calendar | 26-Jan-15 | 30-Jan-15 | 4 | -1 | -522 |
| SPY Short Condor | 12-Feb-15 | 20-Feb-15 | 8 | -66.4 | -588.4 |
| MX Double Calendar | 13-Feb-15 | 20-Mar-15 | 35 | -71.6 | -660 |
| JCP Double Calendar | 25-Feb-15 | 13-Mar-15 | 16 | -3 | -663 |
| KYTH Short Butterfly | 25-Feb-15 | 20-Mar-15 | 23 | -100 | -763 |
| TASR Short Condor | 25-Feb-15 | 20-Mar-15 | 23 | 35 | -728 |
| BBRY Long Butterfly | 24-Mar-15 | 2-Apr-15 | 9 | -84 | -812 |
| BTU Long Put Spread | 12-Jun-15 | 3-Jul-15 | 21 | 117.5 | -694.5 |
| MU Long Put Spread | 17-Jun-15 | 3-Jul-15 | 16 | 71.4 | -623.1 |
| RAD Short Call Spread | 19-Jun-15 | 3-Jul-15 | 14 | 92 | -531.1 |
49 Comments
Kumar August 29th, 2012 at 10:23pm
thanks for your prompt response.
a query on Historical Vol Calc spreadsheet.
when I press GETDATA latest Nifty data is getting updated in the spreadhsheet.
Last row shows date of 28th Aug only
29th Aug Nifty closing prices is NOT Getting automatically picked up.
am I missing anything here
thanks
Peter August 29th, 2012 at 7:58pm
Hi Kumar,
Yes, IV (implied volatility) is only for derivatives (e.g. options). The historical volatility spreadsheet calculates the historical volatility.
Historical volatility = past volatility
Implied volatility = future estimate volatility
Peter August 29th, 2012 at 7:15pm
Hi Mojalefa,
Are you after an online course? If so, check out the Members Area here for video courses on learning options.
Kumar August 29th, 2012 at 5:20am
Thanks for the Historical value spreadsheet It was useful.
a query
I thought IV can be only for different strike price of an underlying index / stock, then how come I see IV for underlying index / stock itself.
thanks
Mojalefa Mokotedi August 17th, 2012 at 5:55am
Hi Peter
I am interested in Financial Markets,could you please advise on which courses should be taken to understand currency options etc.
Peter June 20th, 2012 at 1:18am
Hi James,
Sure, send me an email and I'll reply back with the file.
James June 15th, 2012 at 8:58am
Hi Peter,
I came across some of your previous work where you created a Historical Volatility spreadsheet.
The spreadsheet downloaded historical stock prices from the web and calculated the historical standard deviation for the range of values.
Would you be able to provide me with the VBA code?
Thanks in advance and great work
Peter April 20th, 2012 at 12:30am
Hi Allan,
No worries about the replies - happy to help ;-)
Ok, I think there's some confusion between the market value of the position and the P&L.
So, you bought an option with a strike price of 440, which you paid 16,803. The current price of AAPL is 608.34.
You exercise the option. This means you buy the stock at a purchase price (strike price) of 440. Total cost to buy the stock = 44,000 (440 x 100).
BUT - you have also already "paid" 16,803 for the right to have this position (option premium). So the total "cost" of this position = 60,803.
So now you are long 100 shares of APPL worth 60,803.
The current market value of this position is 60,834 (608.34 x 100).
With the price of AAPL being 608.34 and you having a "long" position of 100 shares worth 60,803 means your profit if you sell the shares back is $31.
allan April 19th, 2012 at 8:49pm
You have a lot of patience Peter-I can tell reading thru all the comments responding to questions. I dont want to beat a dead horse but I still dont have my arms around the value of my appl call if at expiration it has not increased in value. I think at expiration I will receive appl shares worth 608/share since 608 is a price greater than the 440 strike. If correct I will receive shares with a mkt value of 608x100=60,800 for a call that I paid 16,800 in prem (168x100) for a strike price of 440 (440x100=44,000) I think Im even-no out of pocket loss. I know Im wrong and I know it has something to do with extrinsic value but its still not clear to me how much $ I will lose on this trade:(
Peter April 19th, 2012 at 6:30pm
Hi Allan,
I see where you're coming from: that the intrinsic value = the premium? Not always.
The price of an option that you see in the market will be made up of two types of value: intrinsic value and extrinsic value.
For a call option, yes, you're right that the intrinsic value is the maximum between 0 and the stock minus the strike price. But there is also value in the expectation that the option could be worth a lot more by the expiration date - this is called extrinsic value (or time value).
If you did pay 168.03 for the option (that being the market price) then, yes, it is all intrinsic value. It's not worthless - it is worth 168.03, which is the price you paid for it. So, you've not made any profits yet. You've paid money to the option seller and in return received an asset worth 168.03.
If the value of this asset increases and you sell it for a higher price then you will receive money - the difference between what you have paid and received will be your profit.
Add a Comment